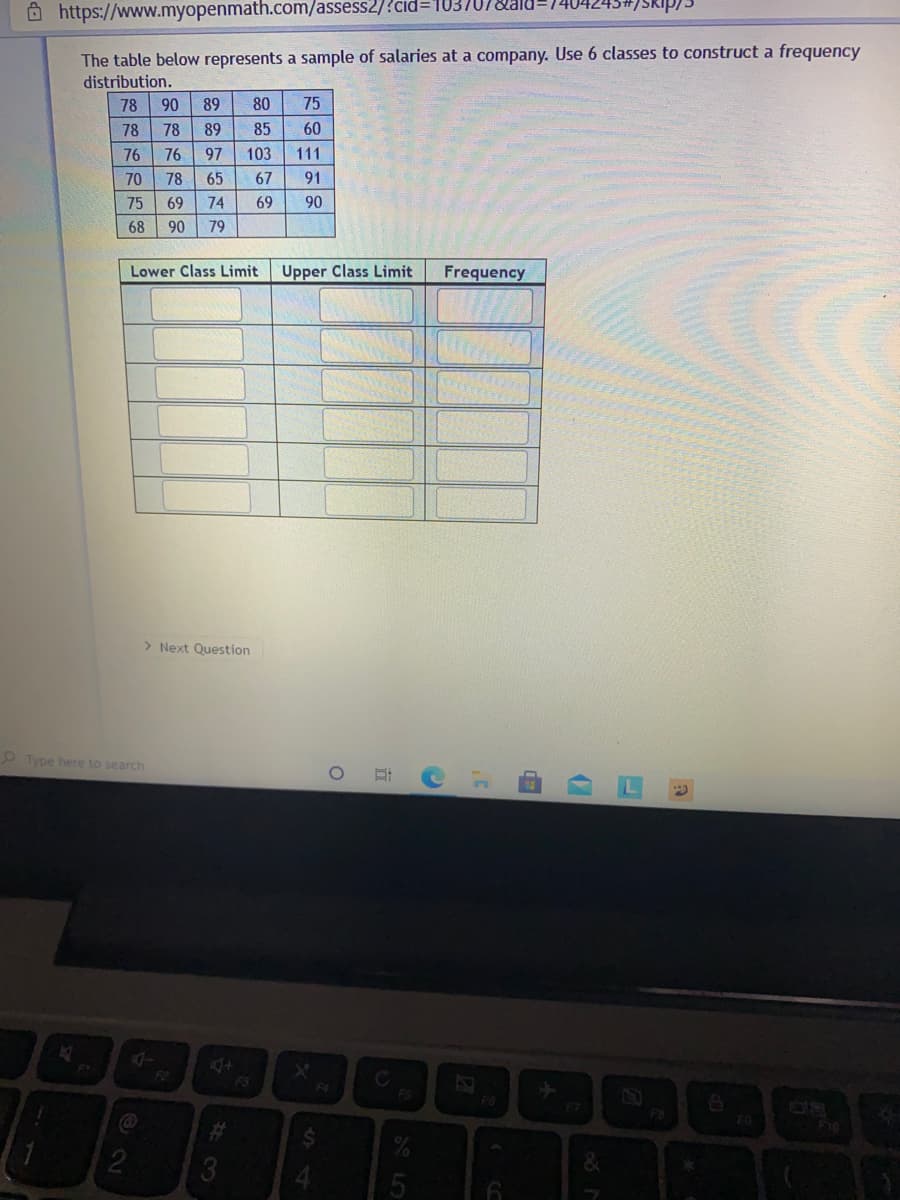
The table below represents a sample of salaries at a company. Use 6 classes to construct a frequency distribution. 78 90 89 80 75 78 78 89 85 60 76 76 97 103 111 70 78 65 67 91 75 69 74 69 90 68 90 79 Lower Class Limit Upper Class Limit Frequency
The table below represents a sample of salaries at a company. Use 6 classes to construct a frequency distribution. 78 90 89 80 75 78 78 89 85 60 76 76 97 103 111 70 78 65 67 91 75 69 74 69 90 68 90 79 Lower Class Limit Upper Class Limit Frequency

Glencoe Algebra 1, Student Edition, 9780079039897, 0079039898, 2018
18th Edition
ISBN:9780079039897
Author:Carter
Publisher:Carter
Chapter10: Statistics
Section10.6: Summarizing Categorical Data
Problem 10CYU

Related questions
Question
Transcribed Image Text:Ô https://www.myopenmath.com/assess2/?cid3D103,
The table below represents a sample of salaries at a company. Use 6 classes to construct a frequency
distribution.
78
90
89
80
75
78
78
89
85
60
76
76
97
103
111
70
78
65
67
91
75
69
74
69
90
68
90
79
Lower Class Limit
Upper Class Limit
Frequency
> Next Question
O Type here to search
4+
F3
F2
FS
F7
F10
Expert Solution
This question has been solved!
Explore an expertly crafted, step-by-step solution for a thorough understanding of key concepts.

This is a popular solution!

Trending now
This is a popular solution!

Step by step
Solved in 2 steps

Knowledge Booster


Learn more about
Need a deep-dive on the concept behind this application? Look no further. Learn more about this topic, probability and related others by exploring similar questions and additional content below.Recommended textbooks for you
Glencoe Algebra 1, Student Edition, 9780079039897…
Algebra
ISBN:
9780079039897
Author:
Carter
Publisher:
McGraw Hill
Glencoe Algebra 1, Student Edition, 9780079039897…
Algebra
ISBN:
9780079039897
Author:
Carter
Publisher:
McGraw Hill