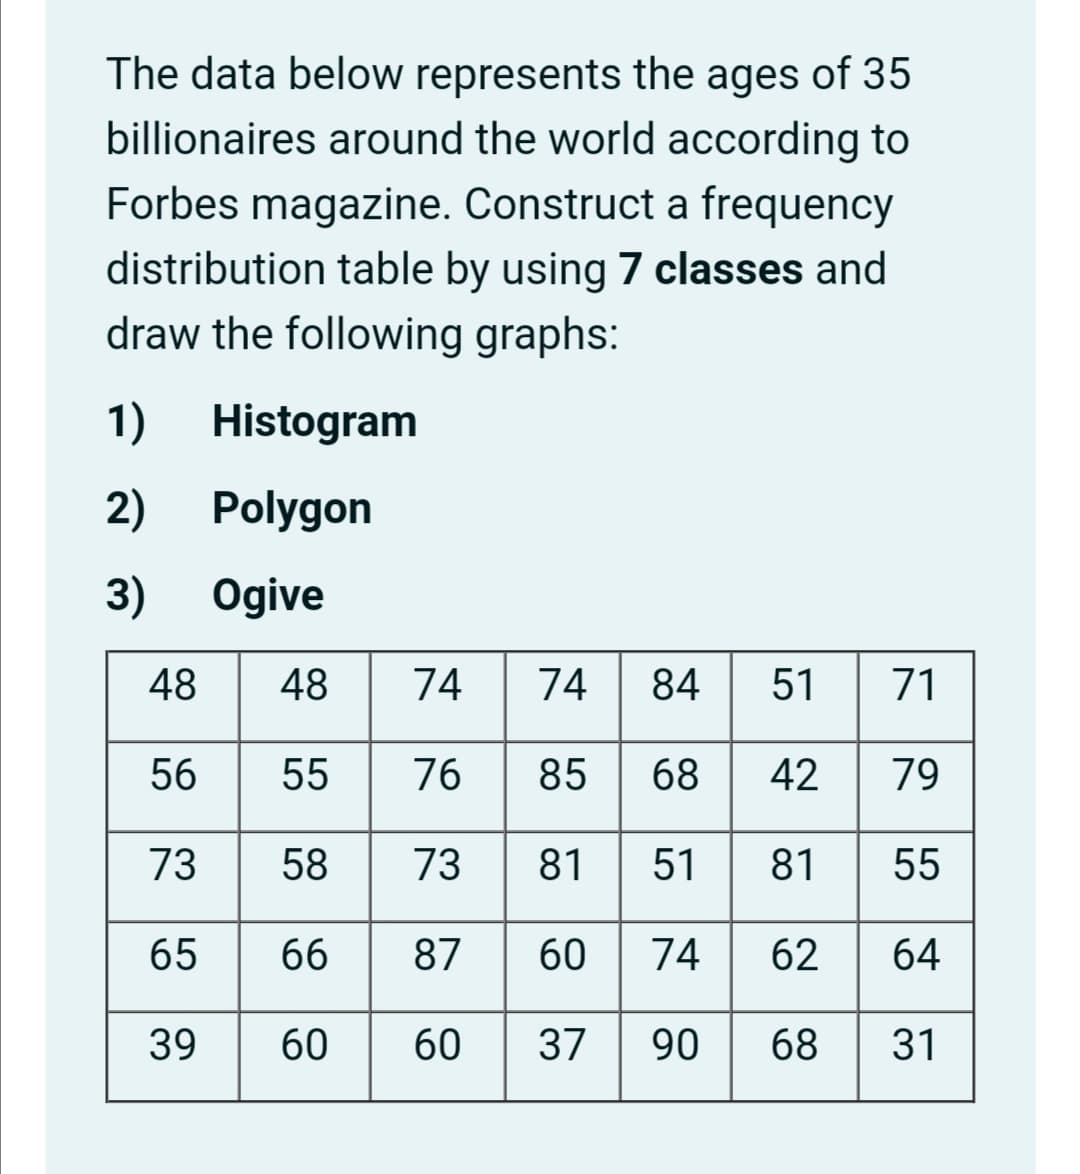
The data below represents the ages of 35 billionaires around the world according to Forbes magazine. Construct a frequency distribution table by using 7 classes and draw the following graphs: 1) Histogram 2) Polygon 3) Ogive 48 48 74 74 84 51 71 56 55 76 85 68 42 79 73 58 73 81 51 81 55 65 66 87 60 74 62 64 39 60 60 37 90 68 31
The data below represents the ages of 35 billionaires around the world according to Forbes magazine. Construct a frequency distribution table by using 7 classes and draw the following graphs: 1) Histogram 2) Polygon 3) Ogive 48 48 74 74 84 51 71 56 55 76 85 68 42 79 73 58 73 81 51 81 55 65 66 87 60 74 62 64 39 60 60 37 90 68 31

Glencoe Algebra 1, Student Edition, 9780079039897, 0079039898, 2018
18th Edition
ISBN:9780079039897
Author:Carter
Publisher:Carter
Chapter10: Statistics
Section10.6: Summarizing Categorical Data
Problem 33PPS

Related questions
Question
Transcribed Image Text:The data below represents the ages of 35
billionaires around the world according to
Forbes magazine. Construct a frequency
distribution table by using 7 classes and
draw the following graphs:
1)
Histogram
2)
Polygon
3)
Ogive
48
48
74
74
84
51
71
56
55
76
85
68
42
79
73
58
73
81
51
81
55
65
66
87
60
74
62
64
39
60
60
37
90
68
31
Expert Solution
This question has been solved!
Explore an expertly crafted, step-by-step solution for a thorough understanding of key concepts.

This is a popular solution!

Trending now
This is a popular solution!

Step by step
Solved in 2 steps with 3 images

Knowledge Booster


Learn more about
Need a deep-dive on the concept behind this application? Look no further. Learn more about this topic, statistics and related others by exploring similar questions and additional content below.Recommended textbooks for you
Glencoe Algebra 1, Student Edition, 9780079039897…
Algebra
ISBN:
9780079039897
Author:
Carter
Publisher:
McGraw Hill
Glencoe Algebra 1, Student Edition, 9780079039897…
Algebra
ISBN:
9780079039897
Author:
Carter
Publisher:
McGraw Hill