The table below show data that has been collected valley. The table contains the grams of Raspberries tested and the amount of their Vitamin C content in mg. Find a linear model that express Vitamin C content as a function of the weight of the Raspberries. Vitamin C grams content in mg 65 16.6 80 23 95 30 110 35.8 125 42.8 140 49.5 155 57.9 A) Find the regression equation: y = Round your answers to 3 decimal places B) Answer the following questions using your un-rounded regression equation. mg (round to If we test 185 grams of raspberries what is the expected Vitamin C content? the nearest tenth)
The table below show data that has been collected valley. The table contains the grams of Raspberries tested and the amount of their Vitamin C content in mg. Find a linear model that express Vitamin C content as a function of the weight of the Raspberries. Vitamin C grams content in mg 65 16.6 80 23 95 30 110 35.8 125 42.8 140 49.5 155 57.9 A) Find the regression equation: y = Round your answers to 3 decimal places B) Answer the following questions using your un-rounded regression equation. mg (round to If we test 185 grams of raspberries what is the expected Vitamin C content? the nearest tenth)

Functions and Change: A Modeling Approach to College Algebra (MindTap Course List)
6th Edition
ISBN:9781337111348
Author:Bruce Crauder, Benny Evans, Alan Noell
Publisher:Bruce Crauder, Benny Evans, Alan Noell
Chapter3: Straight Lines And Linear Functions
Section3.3: Modeling Data With Linear Functions
Problem 1E: Employee Turnover The percentage of employees who cease their employment during a year is referred...

Related questions
Question
The table below show data that has been collected from different fields from various farms in a certain valley. The table contains the grams of raspberries tested and the amount of their vitamin c content in mg. Find a linear model that expresses vitamin c content as a function of the weight of the raspberries.
Transcribed Image Text:A Homework: Section 12.5
ure.com/courses/95724/assignments/1800305?module item id=4997174
Question 1
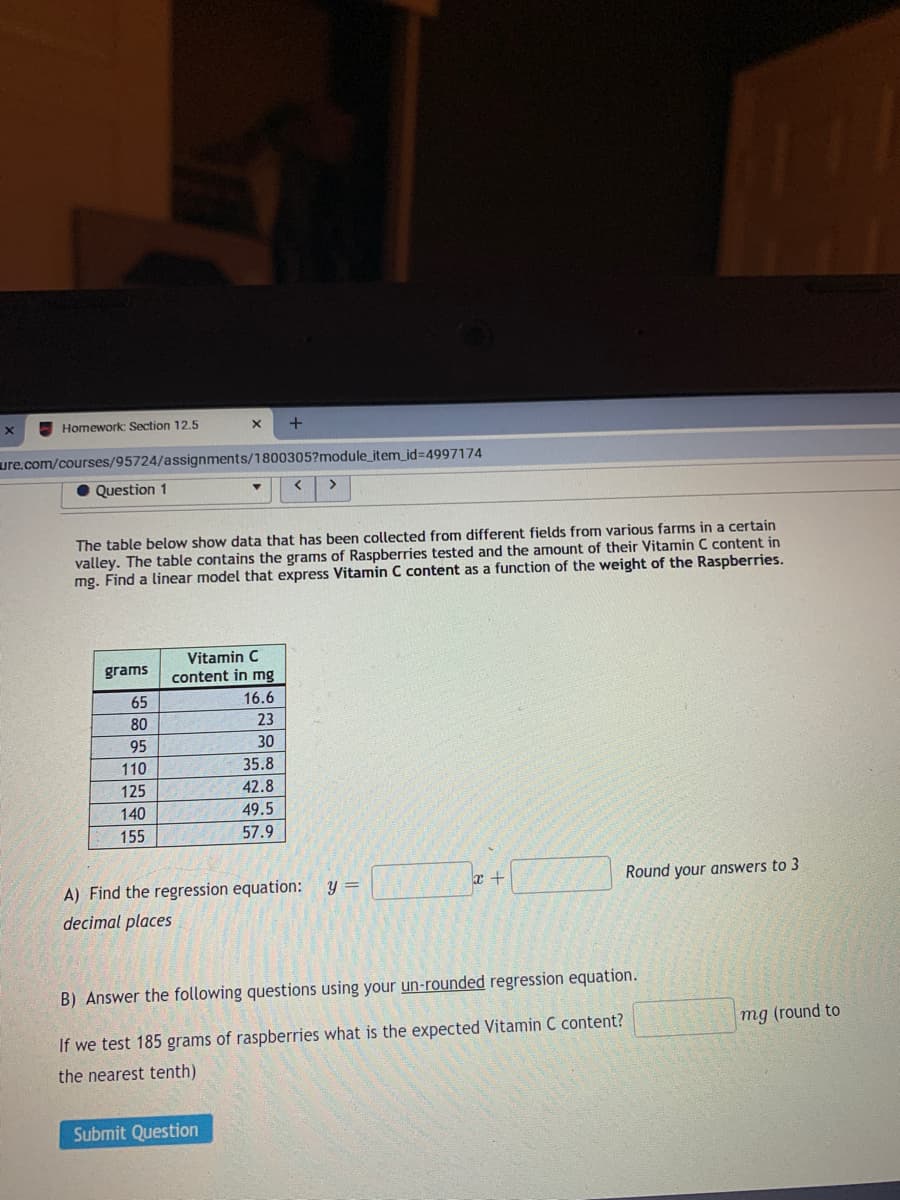
The table below show data that has been collected from different fields from various farms in a certain
valley. The table contains the grams of Raspberries tested and the amount of their Vitamin C content in
mg. Find a linear model that express Vitamin C content as a function of the weight of the Raspberries.
Vitamin C
grams
content in mg
65
16.6
80
23
95
30
110
35.8
125
42.8
140
49.5
155
57.9
A) Find the regression equation:
y =
Round your answers to 3
decimal places
B) Answer the following questions using your un-rounded regression equation.
mg (round to
If we test 185 grams of raspberries what is the expected Vitamin C content?
the nearest tenth)
Submit Question
Expert Solution
This question has been solved!
Explore an expertly crafted, step-by-step solution for a thorough understanding of key concepts.

This is a popular solution!

Trending now
This is a popular solution!

Step by step
Solved in 3 steps with 1 images

Knowledge Booster


Learn more about
Need a deep-dive on the concept behind this application? Look no further. Learn more about this topic, statistics and related others by exploring similar questions and additional content below.Recommended textbooks for you
Functions and Change: A Modeling Approach to Coll…
Algebra
ISBN:
9781337111348
Author:
Bruce Crauder, Benny Evans, Alan Noell
Publisher:
Cengage Learning

Algebra & Trigonometry with Analytic Geometry
Algebra
ISBN:
9781133382119
Author:
Swokowski
Publisher:
Cengage

Big Ideas Math A Bridge To Success Algebra 1: Stu…
Algebra
ISBN:
9781680331141
Author:
HOUGHTON MIFFLIN HARCOURT
Publisher:
Houghton Mifflin Harcourt
Functions and Change: A Modeling Approach to Coll…
Algebra
ISBN:
9781337111348
Author:
Bruce Crauder, Benny Evans, Alan Noell
Publisher:
Cengage Learning
Algebra & Trigonometry with Analytic Geometry
Algebra
ISBN:
9781133382119
Author:
Swokowski
Publisher:
Cengage
Big Ideas Math A Bridge To Success Algebra 1: Stu…
Algebra
ISBN:
9781680331141
Author:
HOUGHTON MIFFLIN HARCOURT
Publisher:
Houghton Mifflin Harcourt
