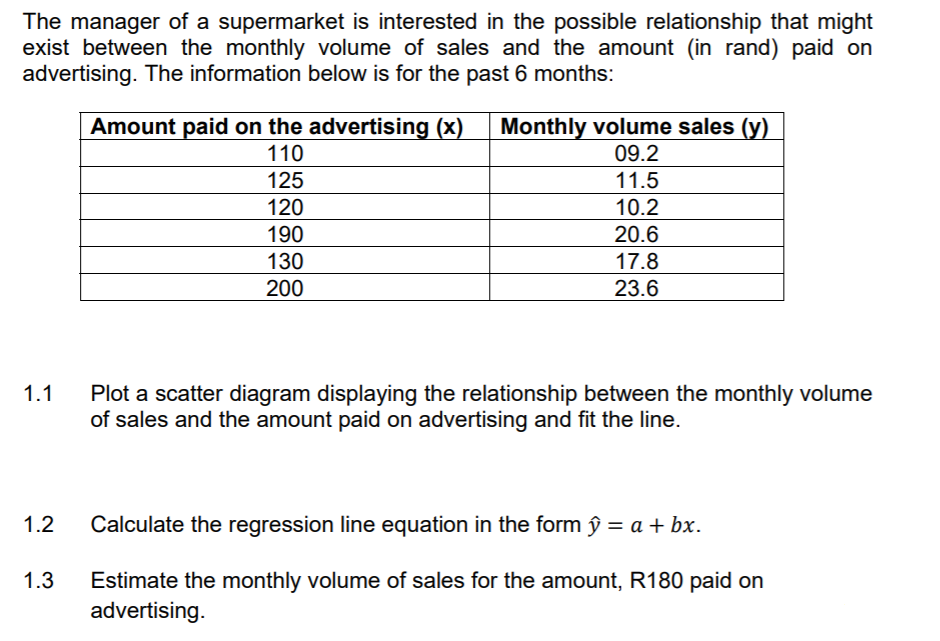
The manager of a supermarket is interested in the possible relationship that might exist between the monthly volume of sales and the amount (in rand) paid on advertising. The information below is for the past 6 months: Amount paid on the advertising (x) Monthly volume sales (y) 09.2 110 125 11.5 120 10.2 190 20.6 130 17.8 200 23.6 1.1 Plot a scatter diagram displaying the relationship between the monthly volume of sales and the amount paid on advertising and fit the line. 1.2 Calculate the regression line equation in the form ŷ = a + bx. Estimate the monthly volume of sales for the amount, R180 paid on advertising. 1.3
The manager of a supermarket is interested in the possible relationship that might exist between the monthly volume of sales and the amount (in rand) paid on advertising. The information below is for the past 6 months: Amount paid on the advertising (x) Monthly volume sales (y) 09.2 110 125 11.5 120 10.2 190 20.6 130 17.8 200 23.6 1.1 Plot a scatter diagram displaying the relationship between the monthly volume of sales and the amount paid on advertising and fit the line. 1.2 Calculate the regression line equation in the form ŷ = a + bx. Estimate the monthly volume of sales for the amount, R180 paid on advertising. 1.3

Algebra and Trigonometry (MindTap Course List)
4th Edition
ISBN:9781305071742
Author:James Stewart, Lothar Redlin, Saleem Watson
Publisher:James Stewart, Lothar Redlin, Saleem Watson
Chapter1: Equations And Graphs
Section1.2: Graphs Of Equations In Two Variables; Circles
Problem 111E

Related questions
Topic Video
Question
100%
Transcribed Image Text:The manager of a supermarket is interested in the possible relationship that might
exist between the monthly volume of sales and the amount (in rand) paid on
advertising. The information below is for the past 6 months:
Amount paid on the advertising (x)
Monthly volume sales (y)
09.2
110
125
11.5
120
10.2
190
20.6
130
17.8
200
23.6
1.1
Plot a scatter diagram displaying the relationship between the monthly volume
of sales and the amount paid on advertising and fit the line.
1.2
Calculate the regression line equation in the form ŷ = a + bx.
1.3
Estimate the monthly volume of sales for the amount, R180 paid on
advertising.
Expert Solution
This question has been solved!
Explore an expertly crafted, step-by-step solution for a thorough understanding of key concepts.

Step by step
Solved in 2 steps with 1 images

Knowledge Booster


Learn more about
Need a deep-dive on the concept behind this application? Look no further. Learn more about this topic, statistics and related others by exploring similar questions and additional content below.Recommended textbooks for you
Algebra and Trigonometry (MindTap Course List)
Algebra
ISBN:
9781305071742
Author:
James Stewart, Lothar Redlin, Saleem Watson
Publisher:
Cengage Learning

Trigonometry (MindTap Course List)
Trigonometry
ISBN:
9781337278461
Author:
Ron Larson
Publisher:
Cengage Learning

Algebra and Trigonometry (MindTap Course List)
Algebra
ISBN:
9781305071742
Author:
James Stewart, Lothar Redlin, Saleem Watson
Publisher:
Cengage Learning
Trigonometry (MindTap Course List)
Trigonometry
ISBN:
9781337278461
Author:
Ron Larson
Publisher:
Cengage Learning

Algebra & Trigonometry with Analytic Geometry
Algebra
ISBN:
9781133382119
Author:
Swokowski
Publisher:
Cengage

Big Ideas Math A Bridge To Success Algebra 1: Stu…
Algebra
ISBN:
9781680331141
Author:
HOUGHTON MIFFLIN HARCOURT
Publisher:
Houghton Mifflin Harcourt

Functions and Change: A Modeling Approach to Coll…
Algebra
ISBN:
9781337111348
Author:
Bruce Crauder, Benny Evans, Alan Noell
Publisher:
Cengage Learning