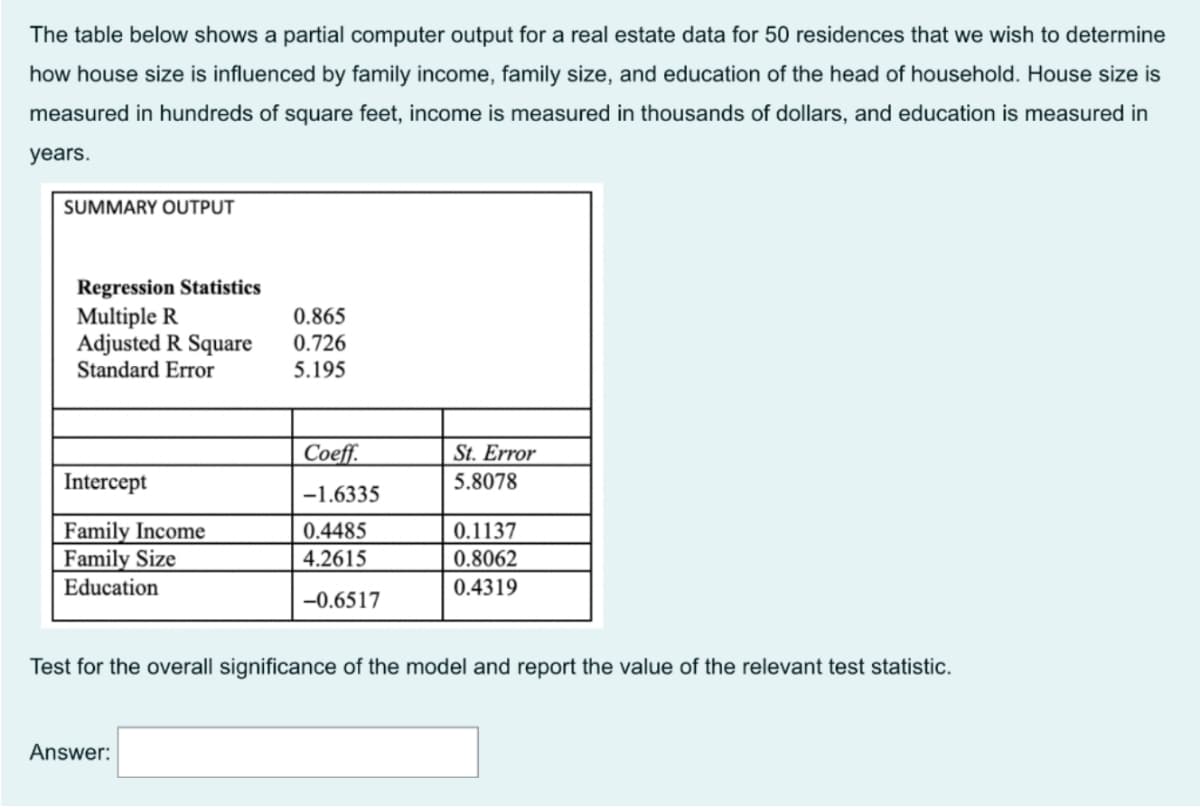
The table below shows a partial computer output for a real estate data for 50 residences that we wish to determine how house size is influenced by family income, family size, and education of the head of household. House size is measured in hundreds of square feet, income is measured in thousands of dollars, and education is measured in years. SUMMARY OUTPUT Regression Statistics Multiple R Adjusted R Square Standard Error 0.865 0.726 5.195 Coeff. St. Error Intercept 5.8078 -1.6335 Family Income Family Size 0.4485 4.2615 0.1137 0.8062 Education 0.4319 -0.6517 Test for the overall significance of the model and report the value of the relevant test statistic. Answer:
The table below shows a partial computer output for a real estate data for 50 residences that we wish to determine how house size is influenced by family income, family size, and education of the head of household. House size is measured in hundreds of square feet, income is measured in thousands of dollars, and education is measured in years. SUMMARY OUTPUT Regression Statistics Multiple R Adjusted R Square Standard Error 0.865 0.726 5.195 Coeff. St. Error Intercept 5.8078 -1.6335 Family Income Family Size 0.4485 4.2615 0.1137 0.8062 Education 0.4319 -0.6517 Test for the overall significance of the model and report the value of the relevant test statistic. Answer:

Linear Algebra: A Modern Introduction
4th Edition
ISBN:9781285463247
Author:David Poole
Publisher:David Poole
Chapter7: Distance And Approximation
Section7.3: Least Squares Approximation
Problem 31EQ

Related questions
Question
D7)
Transcribed Image Text:The table below shows a partial computer output for a real estate data for 50 residences that we wish to determine
how house size is influenced by family income, family size, and education of the head of household. House size is
measured in hundreds of square feet, income is measured in thousands of dollars, and education is measured in
years.
SUMMARY OUTPUT
Regression Statistics
Multiple R
Adjusted R Square
Standard Error
0.865
0.726
5.195
Coeff.
St. Error
Intercept
5.8078
-1.6335
Family Income
Family Size
Education
0.4485
0.1137
4.2615
0.8062
0.4319
-0.6517
Test for the overall significance of the model and report the value of the relevant test statistic.
Answer:
Expert Solution
This question has been solved!
Explore an expertly crafted, step-by-step solution for a thorough understanding of key concepts.

Step by step
Solved in 2 steps with 1 images

Recommended textbooks for you
Linear Algebra: A Modern Introduction
Algebra
ISBN:
9781285463247
Author:
David Poole
Publisher:
Cengage Learning

Glencoe Algebra 1, Student Edition, 9780079039897…
Algebra
ISBN:
9780079039897
Author:
Carter
Publisher:
McGraw Hill

Big Ideas Math A Bridge To Success Algebra 1: Stu…
Algebra
ISBN:
9781680331141
Author:
HOUGHTON MIFFLIN HARCOURT
Publisher:
Houghton Mifflin Harcourt
Linear Algebra: A Modern Introduction
Algebra
ISBN:
9781285463247
Author:
David Poole
Publisher:
Cengage Learning
Glencoe Algebra 1, Student Edition, 9780079039897…
Algebra
ISBN:
9780079039897
Author:
Carter
Publisher:
McGraw Hill
Big Ideas Math A Bridge To Success Algebra 1: Stu…
Algebra
ISBN:
9781680331141
Author:
HOUGHTON MIFFLIN HARCOURT
Publisher:
Houghton Mifflin Harcourt

Algebra & Trigonometry with Analytic Geometry
Algebra
ISBN:
9781133382119
Author:
Swokowski
Publisher:
Cengage