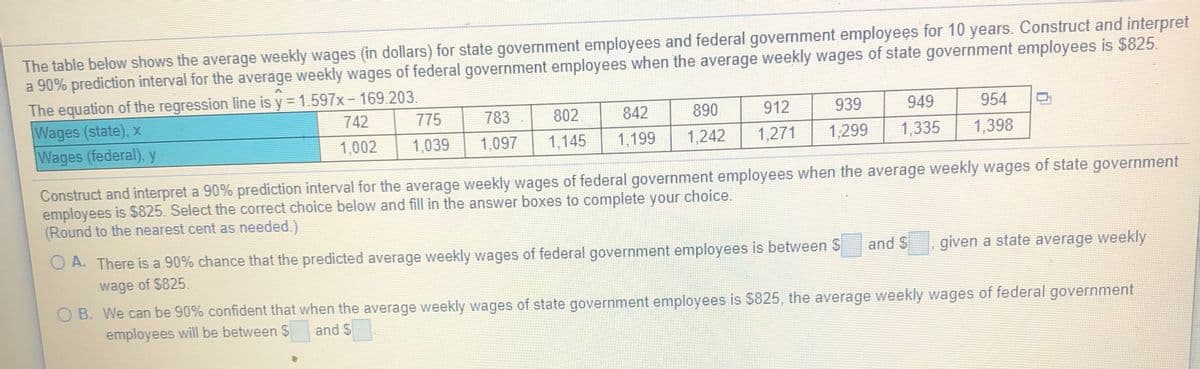
The table below shows the average weekly wages (in dollars) for state government employees and federal government employees for 10 years. Construct and interpret a 90% prediction interval for the average weekly wages of federal government employees when the average weekly wages of state government employees is $825. The equation of the regression line is y = 1.597x-169.203. Wages (state), x Wages (federal), y 742 775 783 802 842 890 912 939 949 954 1,002 1,039 1,097 1,145 1,199 1,242 1,271 1,299 1,335 1,398 Construct and interpret a 90% prediction interval for the average weekly wages of federal government employees when the average weekly wages of state government employees is $825. Select the correct choice below and fill in the answer boxes to complete your choice. (Round to the nearest cent as needed.) O A. There is a 90% chance that the predicted average weekly wages of federal government employees is between S and $ given a state average weekly wage of $825. O B. We can be 90% confident that when the average weekly wages of state government employees is $825, the average weekly wages of federal government employees will be between $ and $


Correlation
Correlation defines a relationship between two independent variables. It tells the degree to which variables move in relation to each other. When two sets of data are related to each other, there is a correlation between them.
Linear Correlation
A correlation is used to determine the relationships between numerical and categorical variables. In other words, it is an indicator of how things are connected to one another. The correlation analysis is the study of how variables are related.
Regression Analysis
Regression analysis is a statistical method in which it estimates the relationship between a dependent variable and one or more independent variable. In simple terms dependent variable is called as outcome variable and independent variable is called as predictors. Regression analysis is one of the methods to find the trends in data. The independent variable used in Regression analysis is named Predictor variable. It offers data of an associated dependent variable regarding a particular outcome.


Trending now
This is a popular solution!

Step by step
Solved in 2 steps with 1 images


