The table below shows the frequency distribution of the rainfall on 52 consecutive Mondays in a certain city. Use the frequency distribution to construct a histogram. Do the data appear to have a distribution that is approximately normal? Class 0-0.19 0.20 0.39 0.40-0.59 0.60 0.79 0.80 -0.99 1.00-1.19 1.20 1.39 Frequency 23 11 6 2 6 1 3 Choose the correct histogram below. A. OB. O C. 30- 20- 10- 0- 0.0 0.2 0.4 0.6 0.8 1.0 1.2 1.4 30 20- 10- 0.0 0.2 0.4 0.6 0.8 1.0 1.2 1.4. 30- 20- 10- 0- 0.0 0.2 0.4 0.6 0.8 1.0 1.2 1.4 Q 2 Q ✔ Q Do the data appear to have a distribution that is approximately normal? OA. Yes, it is approximately normal. OB. No, it is not symmetric. OC. No, it has no obvious maximum. OD. No, it is approximately uniform.
The table below shows the frequency distribution of the rainfall on 52 consecutive Mondays in a certain city. Use the frequency distribution to construct a histogram. Do the data appear to have a distribution that is approximately normal? Class 0-0.19 0.20 0.39 0.40-0.59 0.60 0.79 0.80 -0.99 1.00-1.19 1.20 1.39 Frequency 23 11 6 2 6 1 3 Choose the correct histogram below. A. OB. O C. 30- 20- 10- 0- 0.0 0.2 0.4 0.6 0.8 1.0 1.2 1.4 30 20- 10- 0.0 0.2 0.4 0.6 0.8 1.0 1.2 1.4. 30- 20- 10- 0- 0.0 0.2 0.4 0.6 0.8 1.0 1.2 1.4 Q 2 Q ✔ Q Do the data appear to have a distribution that is approximately normal? OA. Yes, it is approximately normal. OB. No, it is not symmetric. OC. No, it has no obvious maximum. OD. No, it is approximately uniform.

Glencoe Algebra 1, Student Edition, 9780079039897, 0079039898, 2018
18th Edition
ISBN:9780079039897
Author:Carter
Publisher:Carter
Chapter10: Statistics
Section10.4: Distributions Of Data
Problem 19PFA

Related questions
Question
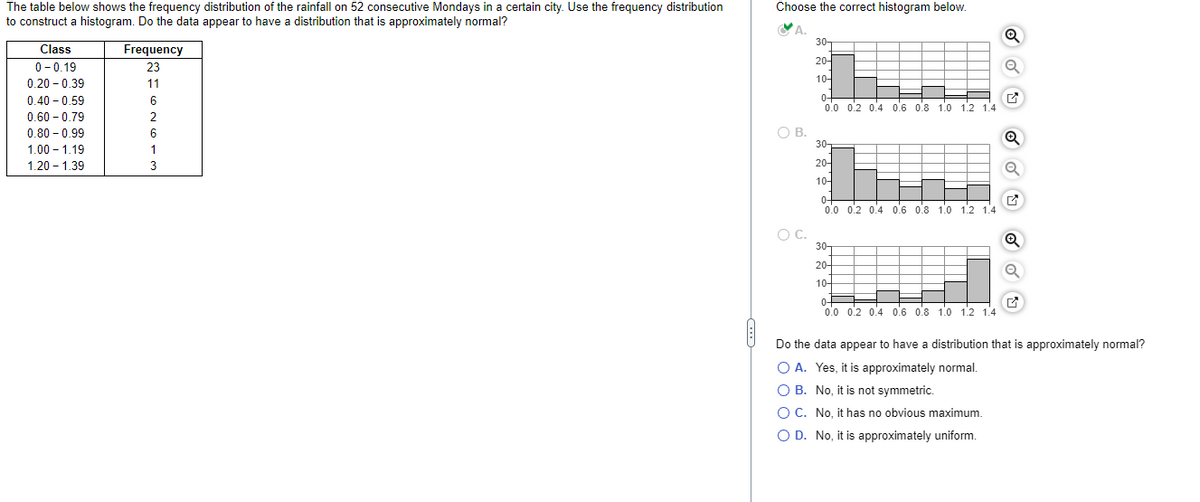
Transcribed Image Text:The table below shows the frequency distribution of the rainfall on 52 consecutive Mondays in a certain city. Use the frequency distribution
to construct a histogram. Do the data appear to have a distribution that is approximately normal?
Class
0-0.19
0.20 -0.39
0.40 -0.59
0.60 -0.79
0.80 0.99
1.00-1.19
1.20-1.39
Frequency
23
11
6
2
6
1
3
Choose the correct histogram below.
A.
O B.
O C.
30-
20-
10-
0.0 0.2 0.4 0.6 0.8 1.0 1.2 1.4
30-
20-
10-
0.0 0.2 0.4 0.6 0.8 1.0 1.2 1.4
30-
20-
10-
0+
0.0 0.2 0.4 0.6 0.8 10 12 14
Q
Q
Q
Do the data appear to have a distribution that is approximately normal?
O A. Yes, it is approximately normal.
O B. No, it is not symmetric.
O C. No, it has no obvious maximum.
O D. No, it is approximately uniform.
Expert Solution
This question has been solved!
Explore an expertly crafted, step-by-step solution for a thorough understanding of key concepts.

This is a popular solution!

Trending now
This is a popular solution!

Step by step
Solved in 3 steps with 1 images

Recommended textbooks for you
Glencoe Algebra 1, Student Edition, 9780079039897…
Algebra
ISBN:
9780079039897
Author:
Carter
Publisher:
McGraw Hill
Glencoe Algebra 1, Student Edition, 9780079039897…
Algebra
ISBN:
9780079039897
Author:
Carter
Publisher:
McGraw Hill