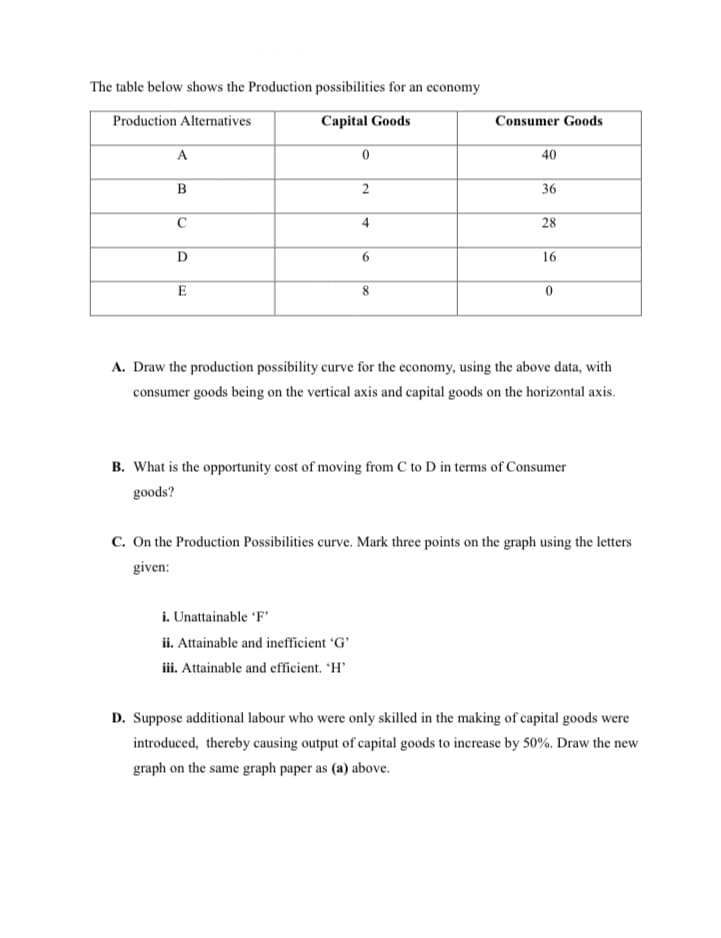
The table below shows the Production possibilities for an economy Production Alternatives Capital Goods A B C D E 0 2 6 i. Unattainable 'F' ii. Attainable and inefficient 'G' iii. Attainable and efficient. 'H' 8 Consumer Goods 40 36 28 16 0 A. Draw the production possibility curve for the economy, using the above data, with consumer goods being on the vertical axis and capital goods on the horizontal axis. B. What is the opportunity cost of moving from C to D in terms of Consumer goods? C. On the Production Possibilities curve. Mark three points on the graph using the letters given: D. Suppose additional labour who were only skilled in the making of capital goods were introduced, thereby causing output of capital goods to increase by 50%. Draw the new graph on the same graph paper as (a) above.
The table below shows the Production possibilities for an economy Production Alternatives Capital Goods A B C D E 0 2 6 i. Unattainable 'F' ii. Attainable and inefficient 'G' iii. Attainable and efficient. 'H' 8 Consumer Goods 40 36 28 16 0 A. Draw the production possibility curve for the economy, using the above data, with consumer goods being on the vertical axis and capital goods on the horizontal axis. B. What is the opportunity cost of moving from C to D in terms of Consumer goods? C. On the Production Possibilities curve. Mark three points on the graph using the letters given: D. Suppose additional labour who were only skilled in the making of capital goods were introduced, thereby causing output of capital goods to increase by 50%. Draw the new graph on the same graph paper as (a) above.
Chapter3: Scarcity, Trade-offs, And Production Possibilities
Section: Chapter Questions
Problem 6P
Related questions
Question

Transcribed Image Text:The table below shows the Production possibilities for an economy
Production Alternatives
Capital Goods
A
B
с
D
E
0
2
6
i. Unattainable 'F'
ii. Attainable and inefficient 'G'
iii. Attainable and efficient. 'H'
Consumer Goods
40
36
28
16
0
A. Draw the production possibility curve for the economy, using the above data, with
consumer goods being on the vertical axis and capital goods on the horizontal axis.
B. What is the opportunity cost of moving from C to D in terms of Consumer
goods?
C. On the Production Possibilities curve. Mark three points on the graph using the letters
given:
D. Suppose additional labour who were only skilled in the making of capital goods were
introduced, thereby causing output of capital goods to increase by 50%. Draw the new
graph on the same graph paper as (a) above.
Expert Solution
This question has been solved!
Explore an expertly crafted, step-by-step solution for a thorough understanding of key concepts.
This is a popular solution!
Trending now
This is a popular solution!
Step by step
Solved in 2 steps with 2 images

Knowledge Booster
Learn more about
Need a deep-dive on the concept behind this application? Look no further. Learn more about this topic, economics and related others by exploring similar questions and additional content below.Recommended textbooks for you

Exploring Economics
Economics
ISBN:
9781544336329
Author:
Robert L. Sexton
Publisher:
SAGE Publications, Inc


Exploring Economics
Economics
ISBN:
9781544336329
Author:
Robert L. Sexton
Publisher:
SAGE Publications, Inc


Essentials of Economics (MindTap Course List)
Economics
ISBN:
9781337091992
Author:
N. Gregory Mankiw
Publisher:
Cengage Learning

Principles of Economics 2e
Economics
ISBN:
9781947172364
Author:
Steven A. Greenlaw; David Shapiro
Publisher:
OpenStax
