The table below summarizes x and y values. Find the sample correlation coefficient, rxy using the formula below or by using calculator regression (do not use Excel). Is there a good linear relationship between x and y? (2 points) y 0.0721 0.3891 0.0966 0.4375 0.1238 0.4704 0.1661 0.5089 0.2337 0.5445 0.2608 0.5580 i=1 i=1 0.3273 0.5826
The table below summarizes x and y values. Find the sample correlation coefficient, rxy using the formula below or by using calculator regression (do not use Excel). Is there a good linear relationship between x and y? (2 points) y 0.0721 0.3891 0.0966 0.4375 0.1238 0.4704 0.1661 0.5089 0.2337 0.5445 0.2608 0.5580 i=1 i=1 0.3273 0.5826

Chapter4: Linear Functions
Section: Chapter Questions
Problem 30PT: For the following exercises, use Table 4 which shows the percent of unemployed persons 25 years or...

Related questions
Question
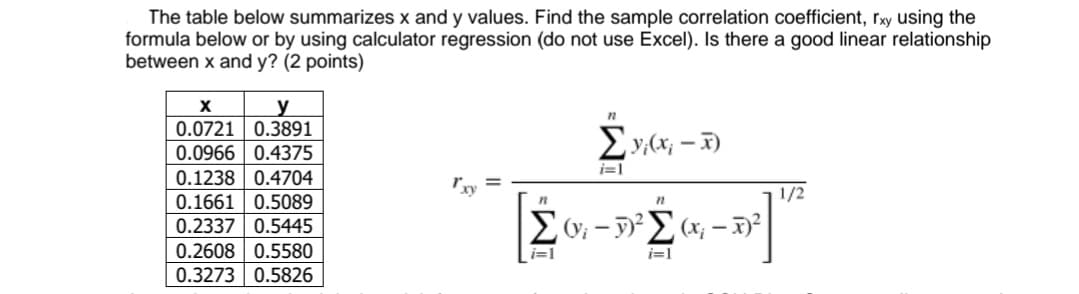
Transcribed Image Text:The table below summarizes x and y values. Find the sample correlation coefficient, rxy using the
formula below or by using calculator regression (do not use Excel). Is there a good linear relationship
between x and y? (2 points)
y
0.0721 | 0.3891
0.0966 0.4375
0.1238 0.4704
0.1661 | 0.5089
0.2337 0.5445
0.2608 0.5580
i=1
1/2
i=1
i=1
0.3273 0.5826
Expert Solution
This question has been solved!
Explore an expertly crafted, step-by-step solution for a thorough understanding of key concepts.

Step by step
Solved in 4 steps with 2 images

Recommended textbooks for you

Glencoe Algebra 1, Student Edition, 9780079039897…
Algebra
ISBN:
9780079039897
Author:
Carter
Publisher:
McGraw Hill
Glencoe Algebra 1, Student Edition, 9780079039897…
Algebra
ISBN:
9780079039897
Author:
Carter
Publisher:
McGraw Hill