Use the following data to determine the following. 2 4 8 10 7 5 3 a) Draw a scatter plot. b) Compute the correlation coefficient using table. c) Find the regression line and graph it on the scatter plot. d) Graph the residual plot
Use the following data to determine the following. 2 4 8 10 7 5 3 a) Draw a scatter plot. b) Compute the correlation coefficient using table. c) Find the regression line and graph it on the scatter plot. d) Graph the residual plot

Glencoe Algebra 1, Student Edition, 9780079039897, 0079039898, 2018
18th Edition
ISBN:9780079039897
Author:Carter
Publisher:Carter
Chapter10: Statistics
Section10.1: Measures Of Center
Problem 9PPS

Related questions
Question
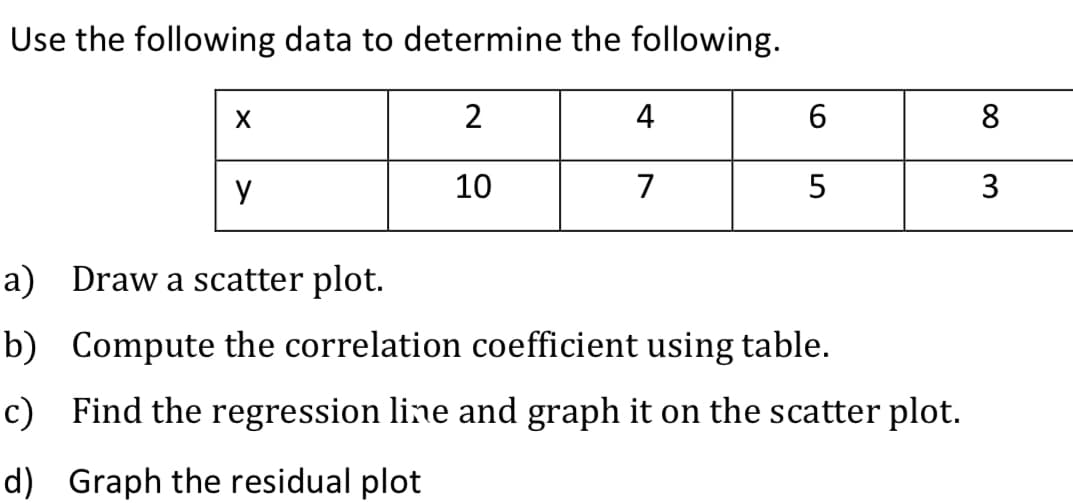
Transcribed Image Text:Use the following data to determine the following.
2
4
8
10
7
5
3
a) Draw a scatter plot.
b) Compute the correlation coefficient using table.
c) Find the regression line and graph it on the scatter plot.
d) Graph the residual plot
Expert Solution
This question has been solved!
Explore an expertly crafted, step-by-step solution for a thorough understanding of key concepts.

Step by step
Solved in 2 steps with 3 images

Recommended textbooks for you
Glencoe Algebra 1, Student Edition, 9780079039897…
Algebra
ISBN:
9780079039897
Author:
Carter
Publisher:
McGraw Hill

Functions and Change: A Modeling Approach to Coll…
Algebra
ISBN:
9781337111348
Author:
Bruce Crauder, Benny Evans, Alan Noell
Publisher:
Cengage Learning
Glencoe Algebra 1, Student Edition, 9780079039897…
Algebra
ISBN:
9780079039897
Author:
Carter
Publisher:
McGraw Hill
Functions and Change: A Modeling Approach to Coll…
Algebra
ISBN:
9781337111348
Author:
Bruce Crauder, Benny Evans, Alan Noell
Publisher:
Cengage Learning