The table describes four possible outcomes for 2017, depending on the level of aggregate demand in that year. Potential GDP is $12 trillion and the natural unemployment rate is 6 percent. Price level (GDP price index 2016 = 100) 112- 111- 110- Price level Unemployment rate (percent of labor force) (2016 = 100) 109- 102.5 9. 108- 105.0 6. 107- C 107.5 4. 106- 110.0 3 105- Draw the four points A,B,C, and D on the aggregate supply curve using the data in the table. Label the points. 104- 103- Draw the short-run aggregate supply curve. Label it AS. >>> Calculate values of real GDP to 1 decimal place. 102- 101- 100- 11.1 11.3 11.5 11.7 11.9 12.1 12.3 12.5 12.7 129 Real GDP (trillions of 2016 dollars) >>> Draw only the obiects specified in the guestion
The table describes four possible outcomes for 2017, depending on the level of aggregate demand in that year. Potential GDP is $12 trillion and the natural unemployment rate is 6 percent. Price level (GDP price index 2016 = 100) 112- 111- 110- Price level Unemployment rate (percent of labor force) (2016 = 100) 109- 102.5 9. 108- 105.0 6. 107- C 107.5 4. 106- 110.0 3 105- Draw the four points A,B,C, and D on the aggregate supply curve using the data in the table. Label the points. 104- 103- Draw the short-run aggregate supply curve. Label it AS. >>> Calculate values of real GDP to 1 decimal place. 102- 101- 100- 11.1 11.3 11.5 11.7 11.9 12.1 12.3 12.5 12.7 129 Real GDP (trillions of 2016 dollars) >>> Draw only the obiects specified in the guestion

Chapter27: The Philips Curve And Expetactions Theory
Section: Chapter Questions
Problem 8SQP

Related questions
Question
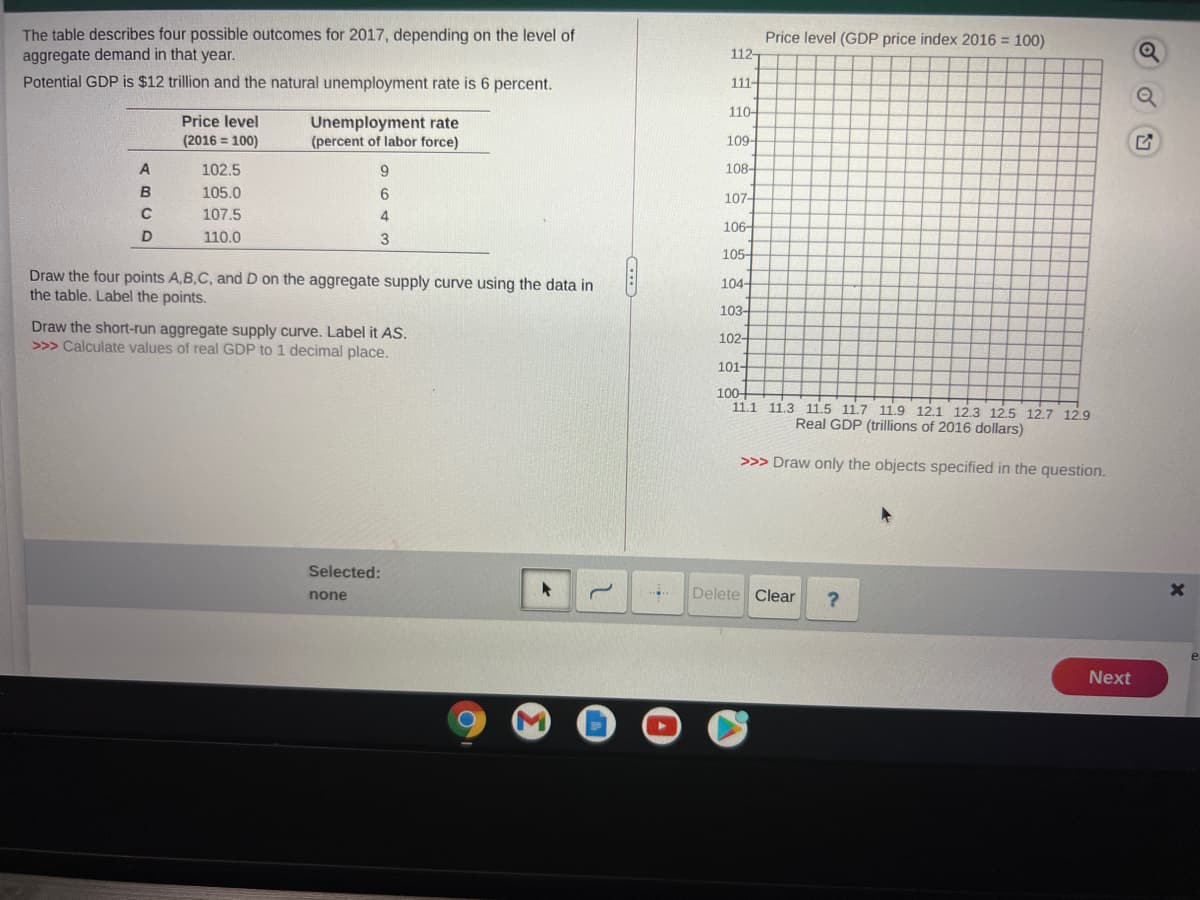
Transcribed Image Text:The table describes four possible outcomes for 2017, depending on the level of
aggregate demand in that year.
Potential GDP is $12 trillion and the natural unemployment rate is 6 percent.
Price level (GDP price index 2016 = 100)
112-
111-
110-
Price level
Unemployment rate
(percent of labor force)
(2016 = 100)
109-
A
102.5
9.
108-
B
105.0
107-
C
107.5
106-
110.0
3
105-
Draw the four points A,B,C, and D on the aggregate supply curve using the data in
the table. Label the points.
104-
103-
Draw the short-run aggregate supply curve. Label it AS.
>>> Calculate values of real GDP to 1 decimal place.
102-
101-
100-
11.1 11.3 11.5 11.7 11.9 12.1 12.3 12.5 12.7 12.9
Real GDP (trillions of 2016 dollars)
>>> Draw only the objects specified in the question.
Selected:
none
Delete Clear
e
Next
Expert Solution
This question has been solved!
Explore an expertly crafted, step-by-step solution for a thorough understanding of key concepts.

This is a popular solution!

Trending now
This is a popular solution!

Step by step
Solved in 2 steps with 1 images

Knowledge Booster


Learn more about
Need a deep-dive on the concept behind this application? Look no further. Learn more about this topic, economics and related others by exploring similar questions and additional content below.Recommended textbooks for you


Macroeconomics: Private and Public Choice (MindTa…
Economics
ISBN:
9781305506756
Author:
James D. Gwartney, Richard L. Stroup, Russell S. Sobel, David A. Macpherson
Publisher:
Cengage Learning
Macroeconomics: Private and Public Choice (MindTa…
Economics
ISBN:
9781305506756
Author:
James D. Gwartney, Richard L. Stroup, Russell S. Sobel, David A. Macpherson
Publisher:
Cengage Learning

Economics: Private and Public Choice (MindTap Cou…
Economics
ISBN:
9781305506725
Author:
James D. Gwartney, Richard L. Stroup, Russell S. Sobel, David A. Macpherson
Publisher:
Cengage Learning


Economics (MindTap Course List)
Economics
ISBN:
9781337617383
Author:
Roger A. Arnold
Publisher:
Cengage Learning