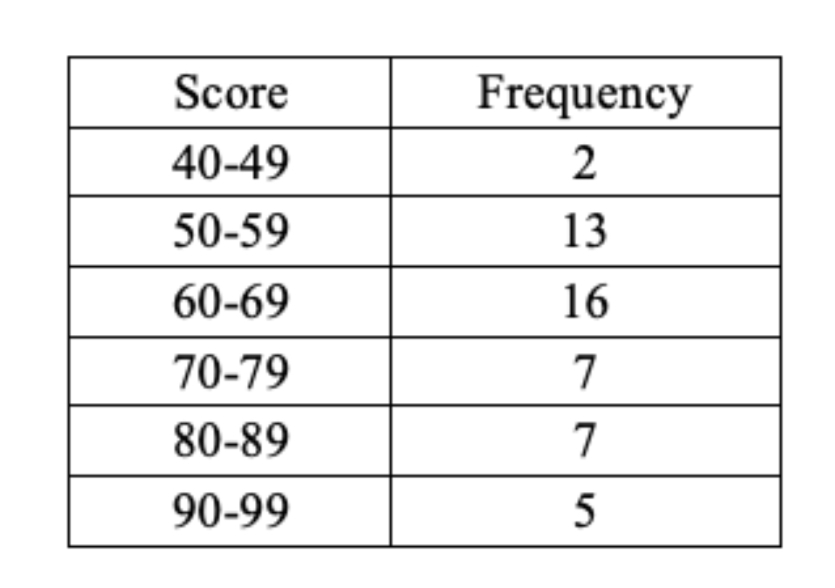
The table in the picture shows the frequency distribution of the scores of 50 students in stat. The passing score was 50. Which of the following is INCORRECT? a. 5% of the students have scores 90 or more b. the lowest score is 40 c. 38% of the students have scores between 70-99 d. only 4% of the students failed the exam
The table in the picture shows the frequency distribution of the scores of 50 students in stat. The passing score was 50. Which of the following is INCORRECT? a. 5% of the students have scores 90 or more b. the lowest score is 40 c. 38% of the students have scores between 70-99 d. only 4% of the students failed the exam

Algebra & Trigonometry with Analytic Geometry
13th Edition
ISBN:9781133382119
Author:Swokowski
Publisher:Swokowski
Chapter1: Fundamental Concepts Of Algebra
Section1.4: Fractional Expressions
Problem 7E

Related questions
Question
The table in the picture shows the frequency distribution of the scores of 50 students in stat. The passing score was 50. Which of the following is INCORRECT?
a. 5% of the students have scores 90 or more
b. the lowest score is 40
c. 38% of the students have scores between 70-99
d. only 4% of the students failed the exam
Transcribed Image Text:Score
Frequency
40-49
50-59
13
60-69
16
70-79
7
80-89
7
90-99
5
Expert Solution
This question has been solved!
Explore an expertly crafted, step-by-step solution for a thorough understanding of key concepts.

Step by step
Solved in 2 steps with 2 images

Recommended textbooks for you
Algebra & Trigonometry with Analytic Geometry
Algebra
ISBN:
9781133382119
Author:
Swokowski
Publisher:
Cengage
Algebra & Trigonometry with Analytic Geometry
Algebra
ISBN:
9781133382119
Author:
Swokowski
Publisher:
Cengage