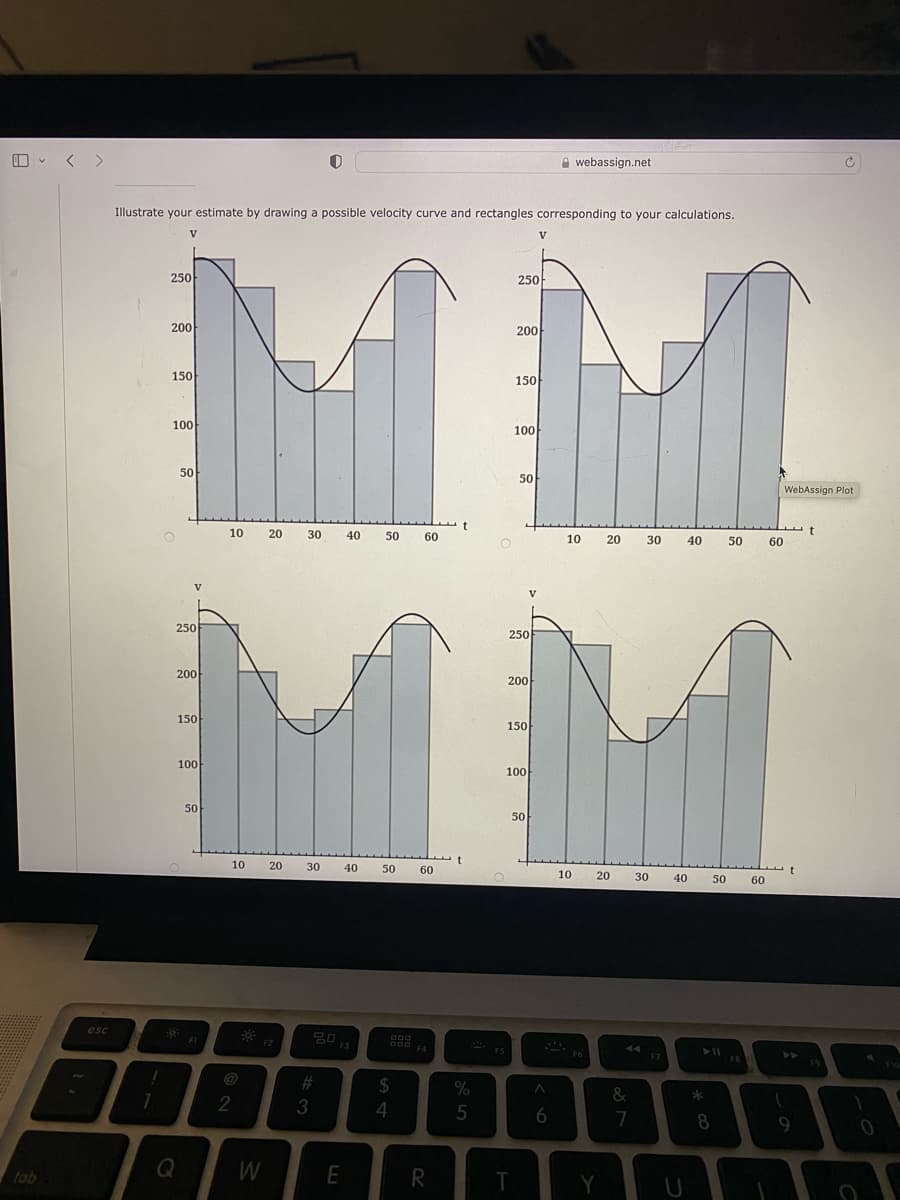
The table shows speedometer readings at 10-second intervals during a 1-minute period for a car racing at the Daytona International Speedway in Florida. Time (s) Velocity (mi/h) 183.1 10 168.2 20 106.8 30 100.0 40 124.7 50 176.3 60 175.8 (a) Estimate the distance the race car traveled during the 1-minute period using the velocities at the end of the time intervals. [Hint: 1 mi/h = (5280/3600) ft/s]. (Round your answer to two decimal places.) mi Illustrate your estimate by drawing a possible velocity curve and rectangles corresponding to your calculations. V V
The table shows speedometer readings at 10-second intervals during a 1-minute period for a car racing at the Daytona International Speedway in Florida. Time (s) Velocity (mi/h) 183.1 10 168.2 20 106.8 30 100.0 40 124.7 50 176.3 60 175.8 (a) Estimate the distance the race car traveled during the 1-minute period using the velocities at the end of the time intervals. [Hint: 1 mi/h = (5280/3600) ft/s]. (Round your answer to two decimal places.) mi Illustrate your estimate by drawing a possible velocity curve and rectangles corresponding to your calculations. V V

College Algebra
7th Edition
ISBN:9781305115545
Author:James Stewart, Lothar Redlin, Saleem Watson
Publisher:James Stewart, Lothar Redlin, Saleem Watson
Chapter2: Functions
Section: Chapter Questions
Problem 9CC

Related questions
Question
4 Can you help me with this
Transcribed Image Text:< >
A webassign.net
Illustrate your estimate by drawing a possible velocity curve and rectangles corresponding to your calculations.
V.
250
250
200
200
150
150
100
100
50
50
WebAssign Plot
10
20
30
40
50
60
10
20
30
40
50
60
V
250
250F
200
200
150
150
100
100
50
50
10
20
30
40
50
60
10
20
30
40
50
60
esc
000
D00 F4
F2
F3
F7
%23
24
%
&
2
3
4
8
9.
tab
T
![The table shows speedometer readings at 10-second intervals during a 1-minute period for a car racing at the Daytona
International Speedway in Florida.
Time (s) Velocity (mi/h)
183.1
10
168.2
20
106.8
30
100.0
40
124.7
50
176.3
60
175.8
(a) Estimate the distance the race car traveled during the 1-minute period using the velocities at the end of the time
intervals. [Hint: 1 mi/h = (5280/3600) ft/s]. (Round your answer to two decimal places.)
mi
Illustrate your estimate by drawing a possible velocity curve and rectangles corresponding to your calculations.
V
V](/v2/_next/image?url=https%3A%2F%2Fcontent.bartleby.com%2Fqna-images%2Fquestion%2F49eefac2-8578-47d1-a9fb-b16dd7aea845%2Fac9f582f-dc7c-4600-873f-33cb0befd71c%2F4sn5x2_processed.jpeg&w=3840&q=75)
Transcribed Image Text:The table shows speedometer readings at 10-second intervals during a 1-minute period for a car racing at the Daytona
International Speedway in Florida.
Time (s) Velocity (mi/h)
183.1
10
168.2
20
106.8
30
100.0
40
124.7
50
176.3
60
175.8
(a) Estimate the distance the race car traveled during the 1-minute period using the velocities at the end of the time
intervals. [Hint: 1 mi/h = (5280/3600) ft/s]. (Round your answer to two decimal places.)
mi
Illustrate your estimate by drawing a possible velocity curve and rectangles corresponding to your calculations.
V
V
Expert Solution
This question has been solved!
Explore an expertly crafted, step-by-step solution for a thorough understanding of key concepts.

This is a popular solution!

Trending now
This is a popular solution!

Step by step
Solved in 2 steps with 2 images

Recommended textbooks for you
College Algebra
Algebra
ISBN:
9781305115545
Author:
James Stewart, Lothar Redlin, Saleem Watson
Publisher:
Cengage Learning
College Algebra
Algebra
ISBN:
9781305115545
Author:
James Stewart, Lothar Redlin, Saleem Watson
Publisher:
Cengage Learning