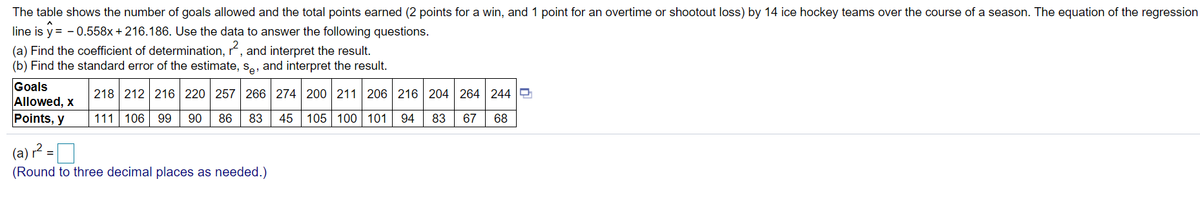
The table shows the number of goals allowed and the total points earned (2 points for a win, and 1 point for an overtime or shootout loss) by 14 ice hockey teams over the course of a season. The equation of the regression line is y = - 0.558x + 216.186. Use the data to answer the following questions. (a) Find the coefficient of determination, , and interpret the result. (b) Find the standard error of the estimate, s,, and interpret the result. Goals Allowed, x Points, y 218 212 216 220 257 266 274 200 211 206 216 204 264 244 O 111 106 99 90 86 83 45 105 100 101 94 83 67 68 (a) r? = D (Round to three decimal places as needed.)


Correlation
Correlation defines a relationship between two independent variables. It tells the degree to which variables move in relation to each other. When two sets of data are related to each other, there is a correlation between them.
Linear Correlation
A correlation is used to determine the relationships between numerical and categorical variables. In other words, it is an indicator of how things are connected to one another. The correlation analysis is the study of how variables are related.
Regression Analysis
Regression analysis is a statistical method in which it estimates the relationship between a dependent variable and one or more independent variable. In simple terms dependent variable is called as outcome variable and independent variable is called as predictors. Regression analysis is one of the methods to find the trends in data. The independent variable used in Regression analysis is named Predictor variable. It offers data of an associated dependent variable regarding a particular outcome.
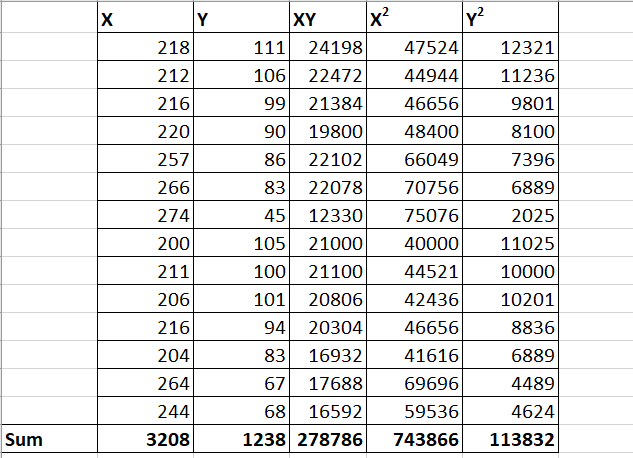
Given,

Trending now
This is a popular solution!

Step by step
Solved in 2 steps with 2 images


