The table shows the results of a cross tabulation of gender and whether a person is happy in his or her marriage, according to data obtained from the a 2008 survey. Complete parts a through c below. Happiness Pretty Нарру Нарру Нарру 190 Gender Not Very Total 290 496 Females Expected Count Males Expected Count Total 16 13.86 179.71 302.43 11 160 299 470 13.14 170.29 286.57 27 350 589 966 a. If we carry out a test to determine whether these variables are associated, is this a test of independence, homogeneity, or goodness of fit? O independence O goodness of fit O homogeneity b. Do a chi-square test with a significance level of 0.05 to determine whether gender and happiness of marriage are associated. Assume that the conditions for the chi-square test have been met. Choose the correct null hypothesis (H) and alternative hypothesis (H,). O A. Ho: Gender and happiness have equal proportions. H: Gender and happiness have non-equal proportions. O B. Ho: Gender and happiness are independent. H: Gender and happiness are associated.
The table shows the results of a cross tabulation of gender and whether a person is happy in his or her marriage, according to data obtained from the a 2008 survey. Complete parts a through c below. Happiness Pretty Нарру Нарру Нарру 190 Gender Not Very Total 290 496 Females Expected Count Males Expected Count Total 16 13.86 179.71 302.43 11 160 299 470 13.14 170.29 286.57 27 350 589 966 a. If we carry out a test to determine whether these variables are associated, is this a test of independence, homogeneity, or goodness of fit? O independence O goodness of fit O homogeneity b. Do a chi-square test with a significance level of 0.05 to determine whether gender and happiness of marriage are associated. Assume that the conditions for the chi-square test have been met. Choose the correct null hypothesis (H) and alternative hypothesis (H,). O A. Ho: Gender and happiness have equal proportions. H: Gender and happiness have non-equal proportions. O B. Ho: Gender and happiness are independent. H: Gender and happiness are associated.

MATLAB: An Introduction with Applications
6th Edition
ISBN:9781119256830
Author:Amos Gilat
Publisher:Amos Gilat
Chapter1: Starting With Matlab
Section: Chapter Questions
Problem 1P

Related questions
Question
i attach part A and B in pics and Part 3 here
Part C. Does this suggest that women and men tend to have different levels of happiness or that their rates of happiness in marriage are about equal?
The rate of happiness in marriage has been found to be significantly higher in women.
No conclusion can be made about the different levels of happiness in marriage based on this test.
The rate of happiness in marriage has not been found to be significantly different for men and women.
The rate of happiness in marriage has been found to be significantly higher in men.
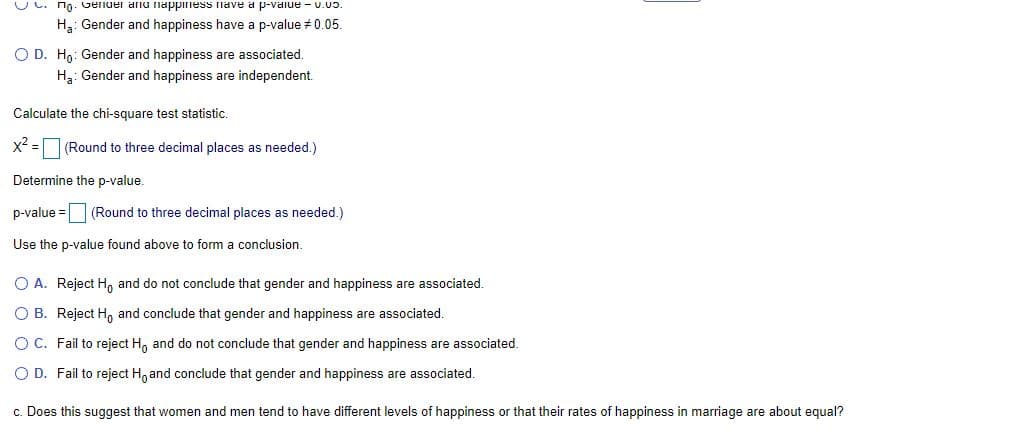
Transcribed Image Text:UC. no. Gender anu ilappiiess fnave a p-vaiue - U.03.
H3: Gender and happiness have a p-value 0.05.
O D. H9: Gender and happiness are associated.
H3: Gender and happiness are independent.
Calculate the chi-square test statistic.
x2 =
(Round to three decimal places as needed.)
Determine the p-value.
p-value =
(Round to three decimal places as needed.)
Use the p-value found above to form a conclusion.
O A. Reject H, and do not conclude that gender and happiness are associated.
O B. Reject H, and conclude that gender and happiness are associated.
OC. Fail to reject H, and do not conclude that gender and happiness are associated.
O D. Fail to reject H, and conclude that gender and happiness are associated.
c. Does this suggest that women and men tend to have different levels of happiness or that their rates of happiness in marriage are about equal?
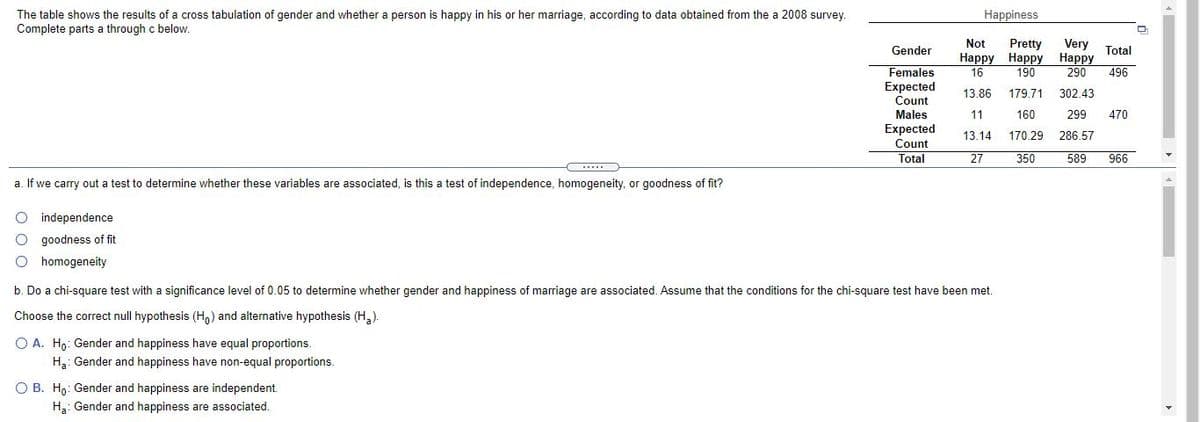
Transcribed Image Text:The table shows the results of a cross tabulation of gender and whether a person is happy in his or her marriage, according to data obtained from the a 2008 survey.
Complete parts a through c below.
Happiness
Gender
Not
Pretty
Very
Total
Наpрy Нарру Наррy
290
Females
Expected
Count
16
190
496
13.86
179.71
302.43
Males
11
160
299
470
Expected
Count
13.14
170.29
286.57
Total
27
350
589
966
a. If we carry out a test to determine whether these variables are associated, is this a test of independence, homogeneity, or goodness of fit?
independence
goodness of fit
homogeneity
b. Do a chi-square test with a significance level of 0.05 to determine whether gender and happiness of marriage are associated. Assume that the conditions for the chi-square test have been met.
Choose the correct null hypothesis (H,) and alternative hypothesis (H,)
O A. Ho: Gender and happiness have equal proportions.
Ha: Gender and happiness have non-equal proportions.
O B. Ho: Gender and happiness are independent.
H3: Gender and happiness are associated.
Expert Solution
This question has been solved!
Explore an expertly crafted, step-by-step solution for a thorough understanding of key concepts.

This is a popular solution!

Trending now
This is a popular solution!

Step by step
Solved in 5 steps

Recommended textbooks for you
MATLAB: An Introduction with Applications
Statistics
ISBN:
9781119256830
Author:
Amos Gilat
Publisher:
John Wiley & Sons Inc

Probability and Statistics for Engineering and th…
Statistics
ISBN:
9781305251809
Author:
Jay L. Devore
Publisher:
Cengage Learning

Statistics for The Behavioral Sciences (MindTap C…
Statistics
ISBN:
9781305504912
Author:
Frederick J Gravetter, Larry B. Wallnau
Publisher:
Cengage Learning
MATLAB: An Introduction with Applications
Statistics
ISBN:
9781119256830
Author:
Amos Gilat
Publisher:
John Wiley & Sons Inc
Probability and Statistics for Engineering and th…
Statistics
ISBN:
9781305251809
Author:
Jay L. Devore
Publisher:
Cengage Learning
Statistics for The Behavioral Sciences (MindTap C…
Statistics
ISBN:
9781305504912
Author:
Frederick J Gravetter, Larry B. Wallnau
Publisher:
Cengage Learning

Elementary Statistics: Picturing the World (7th E…
Statistics
ISBN:
9780134683416
Author:
Ron Larson, Betsy Farber
Publisher:
PEARSON

The Basic Practice of Statistics
Statistics
ISBN:
9781319042578
Author:
David S. Moore, William I. Notz, Michael A. Fligner
Publisher:
W. H. Freeman

Introduction to the Practice of Statistics
Statistics
ISBN:
9781319013387
Author:
David S. Moore, George P. McCabe, Bruce A. Craig
Publisher:
W. H. Freeman