Year 1970 1980 1990 2000 2010 Hours 2000 1880 1730 1690 1570 The table to the right lists the annual hours worked by the average worker in a country for selected years. (a) Let x represent the number of years after 1970. Find a formula in slope-intercept form for a linear function f that models the data. (b) Interpret the slope of the graph of y = f(x). (c) Estimate the annual hours worked in 2018. (a) Find a formula in slope-intercept form for a linear function f that models the data. f(x) = (Use integers or decimals for any numbers in the expression. Round to two decimal places as needed.) (b) Interpret the slope of the graph of y = f(x). Select the correct choice below and fill in the answer box to complete your choice. (Type an integer or a decimal rounded to two decimal places as needed.) O A. Hours worked decreased, on average, by hours per year. O B. Hours worked increased, on average, by hours per year. (c) Estimate the annual hours worked in 2018. The annual hours worked by the average worker in 2018 would be about hours. (Round to the nearest hour as needed.)
Year 1970 1980 1990 2000 2010 Hours 2000 1880 1730 1690 1570 The table to the right lists the annual hours worked by the average worker in a country for selected years. (a) Let x represent the number of years after 1970. Find a formula in slope-intercept form for a linear function f that models the data. (b) Interpret the slope of the graph of y = f(x). (c) Estimate the annual hours worked in 2018. (a) Find a formula in slope-intercept form for a linear function f that models the data. f(x) = (Use integers or decimals for any numbers in the expression. Round to two decimal places as needed.) (b) Interpret the slope of the graph of y = f(x). Select the correct choice below and fill in the answer box to complete your choice. (Type an integer or a decimal rounded to two decimal places as needed.) O A. Hours worked decreased, on average, by hours per year. O B. Hours worked increased, on average, by hours per year. (c) Estimate the annual hours worked in 2018. The annual hours worked by the average worker in 2018 would be about hours. (Round to the nearest hour as needed.)

Functions and Change: A Modeling Approach to College Algebra (MindTap Course List)
6th Edition
ISBN:9781337111348
Author:Bruce Crauder, Benny Evans, Alan Noell
Publisher:Bruce Crauder, Benny Evans, Alan Noell
Chapter3: Straight Lines And Linear Functions
Section3.3: Modeling Data With Linear Functions
Problem 16E: High School Graduates The following table shows the number, in millions, graduating from high school...

Related questions
Question
Transcribed Image Text:Next question
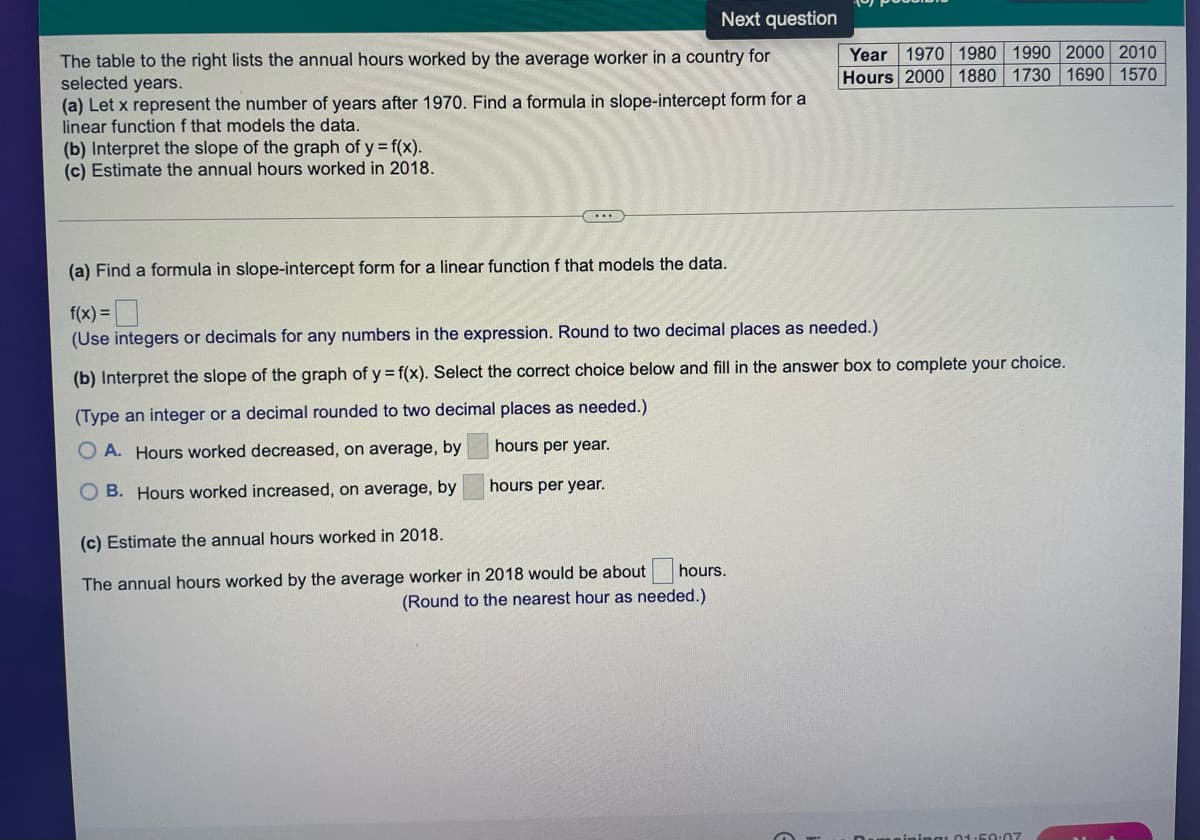
Year 1970 1980 1990 2000 2010
Hours 2000 1880 1730 1690 1570
The table to the right lists the annual hours worked by the average worker in a country for
selected years.
(a) Let x represent the number of years after 1970. Find a formula in slope-intercept form for a
linear function f that models the data.
(b) Interpret the slope of the graph of y = f(x).
(c) Estimate the annual hours worked in 2018.
(a) Find a formula in slope-intercept form for a linear function f that models the data.
f(x) =
(Use integers or decimals for any numbers in the expression. Round to two decimal places as needed.)
(b) Interpret the slope of the graph of y = f(x). Select the correct choice below and fill in the answer box to complete your choice.
(Type an integer or a decimal rounded to two decimal places as needed.)
O A. Hours worked decreased, on average, by
hours per year.
B. Hours worked increased, on average, by
hours per year.
(c) Estimate the annual hours worked in 2018.
hours.
The annual hours worked by the average worker in 2018 would be about
(Round to the nearest hour as needed.)
Expert Solution
This question has been solved!
Explore an expertly crafted, step-by-step solution for a thorough understanding of key concepts.

This is a popular solution!

Trending now
This is a popular solution!

Step by step
Solved in 4 steps with 6 images

Recommended textbooks for you
Functions and Change: A Modeling Approach to Coll…
Algebra
ISBN:
9781337111348
Author:
Bruce Crauder, Benny Evans, Alan Noell
Publisher:
Cengage Learning

Algebra & Trigonometry with Analytic Geometry
Algebra
ISBN:
9781133382119
Author:
Swokowski
Publisher:
Cengage

College Algebra (MindTap Course List)
Algebra
ISBN:
9781305652231
Author:
R. David Gustafson, Jeff Hughes
Publisher:
Cengage Learning
Functions and Change: A Modeling Approach to Coll…
Algebra
ISBN:
9781337111348
Author:
Bruce Crauder, Benny Evans, Alan Noell
Publisher:
Cengage Learning
Algebra & Trigonometry with Analytic Geometry
Algebra
ISBN:
9781133382119
Author:
Swokowski
Publisher:
Cengage
College Algebra (MindTap Course List)
Algebra
ISBN:
9781305652231
Author:
R. David Gustafson, Jeff Hughes
Publisher:
Cengage Learning

College Algebra
Algebra
ISBN:
9781305115545
Author:
James Stewart, Lothar Redlin, Saleem Watson
Publisher:
Cengage Learning


Elementary Linear Algebra (MindTap Course List)
Algebra
ISBN:
9781305658004
Author:
Ron Larson
Publisher:
Cengage Learning