The tables below show a nation's labor demand and labor supply schedules and its production function. Quantity of labor demanded Quantity of labor supplied (billions of hours per year) Real wage rate (2012 dollars) (billions of hours per year) 50 80 100 40 90 90 30 100 80 20 110 70 10 120 60 Employment (billions of hours per year) Real GDP (billions of 2012 dollars) 60 2.0 70 3.0 80 3.7 90 4.2 110 4.5 Given the equilibrium in the labor market, potential GDP is O A. $4.2 trillion. O B. $3.0 trillion. OC. $3.7 trillion. O D. $2.0 trillion. O E. $4.5 trillion.
The tables below show a nation's labor demand and labor supply schedules and its production function. Quantity of labor demanded Quantity of labor supplied (billions of hours per year) Real wage rate (2012 dollars) (billions of hours per year) 50 80 100 40 90 90 30 100 80 20 110 70 10 120 60 Employment (billions of hours per year) Real GDP (billions of 2012 dollars) 60 2.0 70 3.0 80 3.7 90 4.2 110 4.5 Given the equilibrium in the labor market, potential GDP is O A. $4.2 trillion. O B. $3.0 trillion. OC. $3.7 trillion. O D. $2.0 trillion. O E. $4.5 trillion.

Chapter30: The Labor Market
Section: Chapter Questions
Problem 14E

Related questions
Question
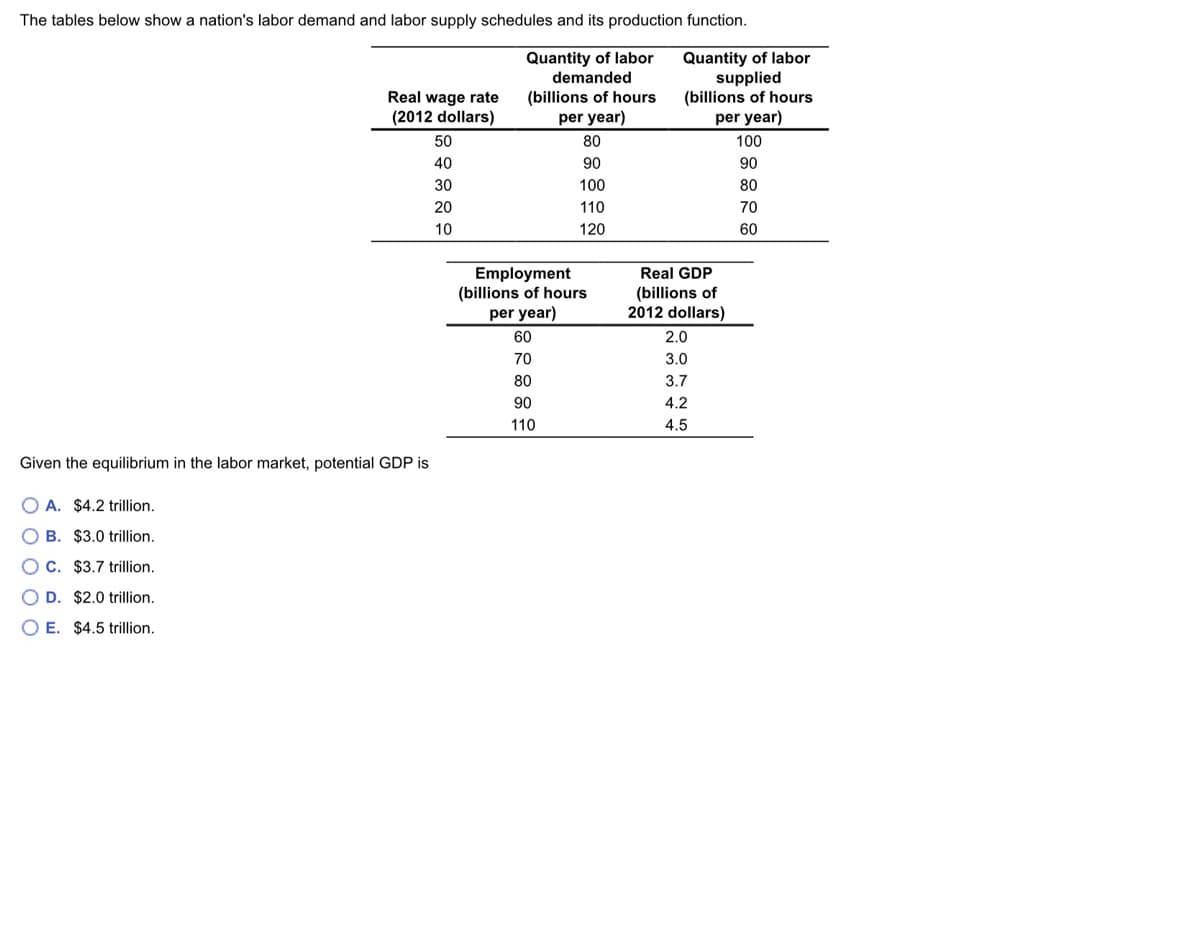
Transcribed Image Text:The tables below show a nation's labor demand and labor supply schedules and its production function.
Quantity of labor
demanded
Quantity of labor
supplied
(billions of hours
per year)
Real wage rate
(2012 dollars)
(billions of hours
per year)
50
80
100
40
90
90
30
100
80
20
110
70
10
120
60
Employment
(billions of hours
per year)
Real GDP
(billions of
2012 dollars)
60
2.0
70
3.0
80
3.7
90
4.2
110
4.5
Given the equilibrium in the labor market, potential GDP is
O A. $4.2 trillion.
O B. $3.0 trillion.
OC. $3.7 trillion.
O D. $2.0 trillion.
O E. $4.5 trillion.
Expert Solution
This question has been solved!
Explore an expertly crafted, step-by-step solution for a thorough understanding of key concepts.

This is a popular solution!

Trending now
This is a popular solution!

Step by step
Solved in 3 steps

Knowledge Booster


Learn more about
Need a deep-dive on the concept behind this application? Look no further. Learn more about this topic, economics and related others by exploring similar questions and additional content below.Recommended textbooks for you

Microeconomics: Principles & Policy
Economics
ISBN:
9781337794992
Author:
William J. Baumol, Alan S. Blinder, John L. Solow
Publisher:
Cengage Learning

Microeconomics: Principles & Policy
Economics
ISBN:
9781337794992
Author:
William J. Baumol, Alan S. Blinder, John L. Solow
Publisher:
Cengage Learning