The tension is gradually increased from zero to a maximum value, and then reduced back to zero. 1.2 TensionAN 1.0 0.8 0.0 0.4 0.2 2 3 6 6 7 Extenslon/10 'm (a) Use the region OL of the graph to find the Young modulus for the material of the wire. (b) Why is the unloading curve displaced from the loading curve? (c) Shade the area of the graph which represents the energy lost as heat during the loading-unloading cycle. [0, '92*)
The tension is gradually increased from zero to a maximum value, and then reduced back to zero. 1.2 TensionAN 1.0 0.8 0.0 0.4 0.2 2 3 6 6 7 Extenslon/10 'm (a) Use the region OL of the graph to find the Young modulus for the material of the wire. (b) Why is the unloading curve displaced from the loading curve? (c) Shade the area of the graph which represents the energy lost as heat during the loading-unloading cycle. [0, '92*)

University Physics Volume 1
18th Edition
ISBN:9781938168277
Author:William Moebs, Samuel J. Ling, Jeff Sanny
Publisher:William Moebs, Samuel J. Ling, Jeff Sanny
Chapter2: Vectors
Section: Chapter Questions
Problem 21CQ: What is wrong with the following expressions? How can you correct them? (a) C=AB , (b) C=AB , (c)...

Related questions

Question
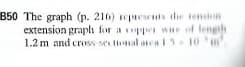
The graph below represent the tension-extension graph for a copper wire of length 1.2 m and cross sectional area 1.5 x 10³m2.
The tension is gradually increased from zero to a maximum value, and then reduced back to zero.
Transcribed Image Text:B50 The graph (p. 210) represens the temin
extension graph for a copper wie of length
1.2 m and cross M tal arca 1 10 m
![The tension is gradually increased from zero to
a maximum value, and then reduced back to
zero.
1.2
Tension AN
1.0
0.8
0.6
0.4
0.2
2
3 4
5 6 7 8
Extension/10 'm
(a) Use the region OL of the graph to find the
Young modulus for the material of the
wire.
(b) Why is the unloading curve displaced
from the loading curve?
(c) Shade the area of the graph which
represents the energy lost as heat during
the loading-unloading cycle. [0, '92*]](/v2/_next/image?url=https%3A%2F%2Fcontent.bartleby.com%2Fqna-images%2Fquestion%2F5a6d9c67-6f13-49d2-ac4d-2d996f90a88b%2Facbb86a9-fc3b-416f-830a-c989b4c2fab5%2F1y4h48_processed.jpeg&w=3840&q=75)
Transcribed Image Text:The tension is gradually increased from zero to
a maximum value, and then reduced back to
zero.
1.2
Tension AN
1.0
0.8
0.6
0.4
0.2
2
3 4
5 6 7 8
Extension/10 'm
(a) Use the region OL of the graph to find the
Young modulus for the material of the
wire.
(b) Why is the unloading curve displaced
from the loading curve?
(c) Shade the area of the graph which
represents the energy lost as heat during
the loading-unloading cycle. [0, '92*]
Expert Solution
This question has been solved!
Explore an expertly crafted, step-by-step solution for a thorough understanding of key concepts.

Step by step
Solved in 3 steps

Knowledge Booster


Learn more about
Need a deep-dive on the concept behind this application? Look no further. Learn more about this topic, physics and related others by exploring similar questions and additional content below.Recommended textbooks for you
University Physics Volume 1
Physics
ISBN:
9781938168277
Author:
William Moebs, Samuel J. Ling, Jeff Sanny
Publisher:
OpenStax - Rice University

Physics for Scientists and Engineers: Foundations…
Physics
ISBN:
9781133939146
Author:
Katz, Debora M.
Publisher:
Cengage Learning

University Physics Volume 1
Physics
ISBN:
9781938168277
Author:
William Moebs, Samuel J. Ling, Jeff Sanny
Publisher:
OpenStax - Rice University
Physics for Scientists and Engineers: Foundations…
Physics
ISBN:
9781133939146
Author:
Katz, Debora M.
Publisher:
Cengage Learning

College Physics
Physics
ISBN:
9781305952300
Author:
Raymond A. Serway, Chris Vuille
Publisher:
Cengage Learning
