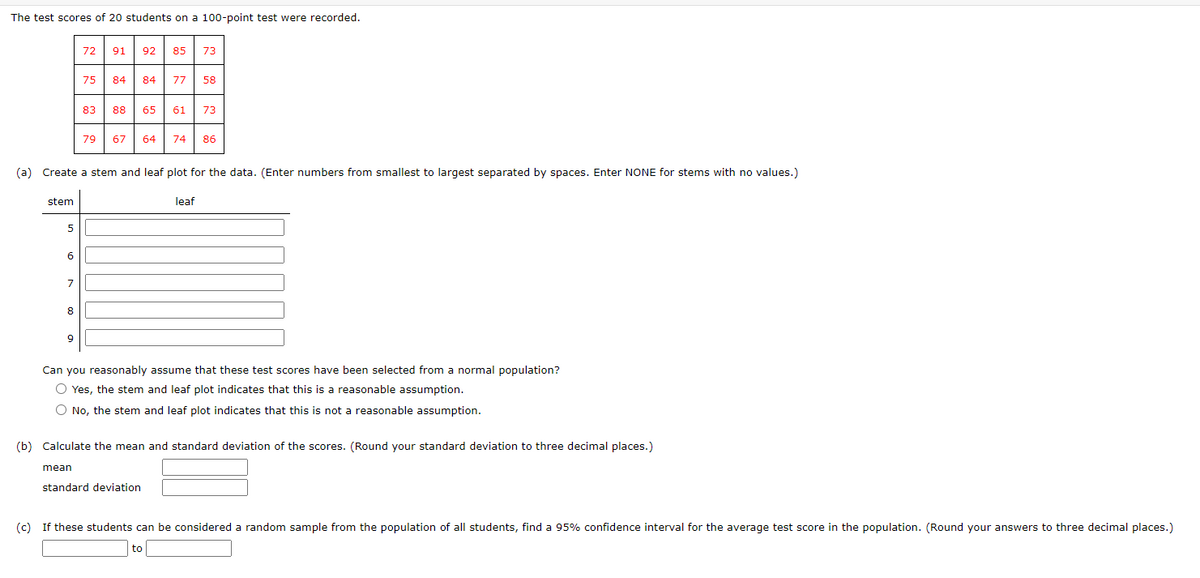
The test scores of 20 students on a 100-point test were recorded. 72 91 92 | 85 73 75 84 84 77 58 83 88 65 61 73 79 67 64 74 86 (a) Create a stem and leaf plot for the data. (Enter numbers from smallest to largest separated by spaces. Enter NONE for stems with no values.) stem leaf 5 6 7 8 Can you reasonably assume that these test scores have been selected from a normal population? O Yes, the stem and leaf plot indicates that this is a reasonable assumption. O No, the stem and leaf plot indicates that this is not a reasonable assumption. (b) Calculate the mean and standard deviation of the scores. (Round your standard deviation to three decimal places.) mean standard deviation (c) If these students can be considered a random sample from the population of all students, find a 95% confidence interval for the average test score in the population. (Round your answers to three decimal places.) to
The test scores of 20 students on a 100-point test were recorded. 72 91 92 | 85 73 75 84 84 77 58 83 88 65 61 73 79 67 64 74 86 (a) Create a stem and leaf plot for the data. (Enter numbers from smallest to largest separated by spaces. Enter NONE for stems with no values.) stem leaf 5 6 7 8 Can you reasonably assume that these test scores have been selected from a normal population? O Yes, the stem and leaf plot indicates that this is a reasonable assumption. O No, the stem and leaf plot indicates that this is not a reasonable assumption. (b) Calculate the mean and standard deviation of the scores. (Round your standard deviation to three decimal places.) mean standard deviation (c) If these students can be considered a random sample from the population of all students, find a 95% confidence interval for the average test score in the population. (Round your answers to three decimal places.) to

Glencoe Algebra 1, Student Edition, 9780079039897, 0079039898, 2018
18th Edition
ISBN:9780079039897
Author:Carter
Publisher:Carter
Chapter10: Statistics
Section10.4: Distributions Of Data
Problem 20PFA

Related questions
Question
100%
19
Transcribed Image Text:The test scores of 20 students on a 100-point test were recorded.
72
91
92
85
73
75
84
84
77
58
83 88
65
61
73
79
67
64
74
86
(a) Create a stem and leaf plot for the data. (Enter numbers from smallest to largest separated by spaces. Enter NONE for stems with no values.)
stem
leaf
7
8
Can you reasonably assume that these test scores have been selected from a normal population?
O Yes, the stem and leaf plot indicates that this is a reasonable assumption.
O No, the stem and leaf plot indicates that this is not a reasonable assumption.
(b) Calculate the mean and standard deviation of the scores. (Round your standard deviation to three decimal places.)
mean
standard deviation
(c) If these students can be considered a random sample from the population of all students, find a 95% confidence interval for the average test score in the population. (Round your answers to three decimal places.)
to
Expert Solution
This question has been solved!
Explore an expertly crafted, step-by-step solution for a thorough understanding of key concepts.

This is a popular solution!

Trending now
This is a popular solution!

Step by step
Solved in 3 steps with 3 images

Recommended textbooks for you
Glencoe Algebra 1, Student Edition, 9780079039897…
Algebra
ISBN:
9780079039897
Author:
Carter
Publisher:
McGraw Hill
Glencoe Algebra 1, Student Edition, 9780079039897…
Algebra
ISBN:
9780079039897
Author:
Carter
Publisher:
McGraw Hill