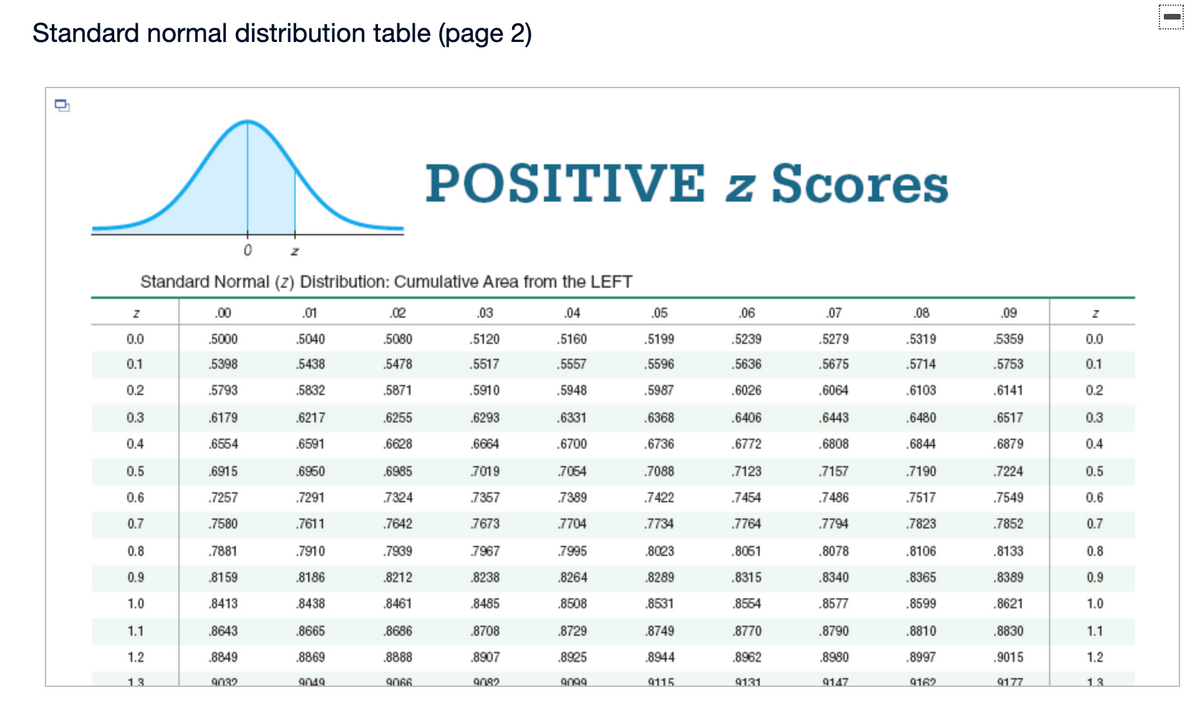
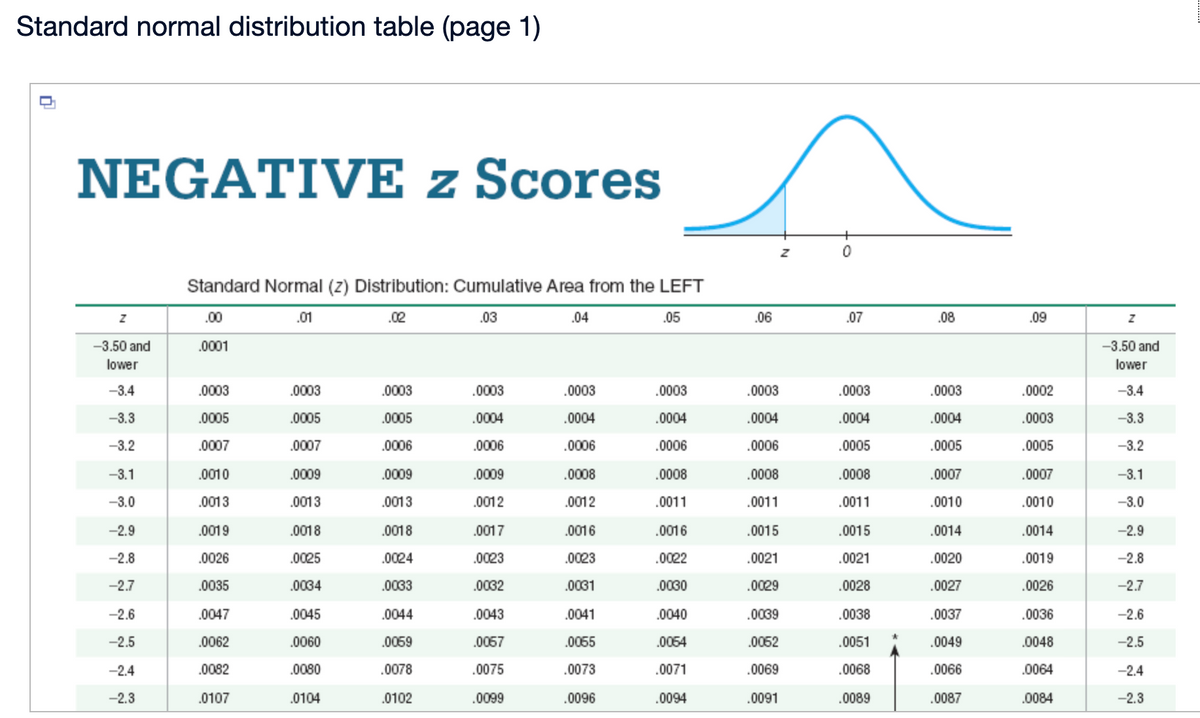
The test statistic of z=2.00 is obtained when testing the claim that p>0.2. a. Identify the hypothesis test as being two-tailed, left-tailed, or right-tailed. b. Find the P-value. c. Using a significance level of α=0.01, should we reject H0 or should we fail to reject H0? a. This is a ▼ left-tailed two-tailed right-tailed test. b. P-value=enter your response here (Round to three decimal places as needed.) c. Choose the correct conclusion below. A. Fail to reject H0. There is not sufficient evidence to support the claim that p>0.2. B. Reject H0. There is not sufficient evidence to support the claim that p>0.2. C. Reject H0. There is sufficient evidence to support the claim that p>0.2. D. Fail to reject H0. There is sufficient evidence to support the claim that p>0.2.
The test statistic of z=2.00 is obtained when testing the claim that p>0.2. a. Identify the hypothesis test as being two-tailed, left-tailed, or right-tailed. b. Find the P-value. c. Using a significance level of α=0.01, should we reject H0 or should we fail to reject H0? a. This is a ▼ left-tailed two-tailed right-tailed test. b. P-value=enter your response here (Round to three decimal places as needed.) c. Choose the correct conclusion below. A. Fail to reject H0. There is not sufficient evidence to support the claim that p>0.2. B. Reject H0. There is not sufficient evidence to support the claim that p>0.2. C. Reject H0. There is sufficient evidence to support the claim that p>0.2. D. Fail to reject H0. There is sufficient evidence to support the claim that p>0.2.

MATLAB: An Introduction with Applications
6th Edition
ISBN:9781119256830
Author:Amos Gilat
Publisher:Amos Gilat
Chapter1: Starting With Matlab
Section: Chapter Questions
Problem 1P

Related questions
Question
The test statistic of z=2.00 is obtained when testing the claim that p>0.2.
a. Identify the hypothesis test as being two-tailed, left-tailed, or right-tailed.
b. Find the P-value.
c. Using a significance level of
A.
B.
C.
D.
α=0.01,
should we reject
H0
or should we fail to reject
H0?
a. This is a
test.
▼
left-tailed
two-tailed
right-tailed
b.
P-value=enter your response here
(Round to three decimal places as needed.)c. Choose the correct conclusion below.
Fail to reject
H0.
There
is not
sufficient evidence to support the claim that
p>0.2.
Reject
H0.
There
is not
sufficient evidence to support the claim that
p>0.2.
Reject
H0.
There
is
sufficient evidence to support the claim that
p>0.2.
Fail to reject
H0.
There
is
sufficient evidence to support the claim that
p>0.2.
Transcribed Image Text:Standard normal distribution table (page 2)
POSITIVE z Scores
Standard Normal (2) Distribution: Cumulative Area from the LEFT
.00
.01
.02
.03
.04
.05
.06
.07
.08
.09
0.0
.5000
.5040
.5080
.5120
.5160
.5199
.5239
.5279
.5319
.5359
0.0
0.1
.5398
.5438
.5478
.5517
.5557
.5596
.5636
.5675
.5714
.5753
0.1
0.2
.5793
.5832
.5871
.5910
.5948
.5987
.6026
.6064
.6103
.6141
0.2
0.3
.6179
.6217
.6255
.6293
.6331
.6368
.6406
.6443
.6480
.6517
0.3
0.4
.6554
.6591
.6628
.6664
.6700
.6736
.6772
.6808
.6844
.6879
0.4
0.5
.6915
.6960
.6985
7019
.7054
.7088
.7123
.7157
.7190
.7224
0.5
0.6
.7257
.7291
.7324
.7357
7389
.7422
.7454
.7486
.7517
.7549
0.6
0.7
.7580
.7611
.7642
.7673
7704
.7734
.7764
.7794
.7823
.7852
0.7
0.8
.7881
.7910
.7939
7967
7995
.8023
.8061
.8078
.8106
.8133
0.8
0.9
.8159
.8186
.8212
.8238
.8264
.8289
.8315
.8340
.8365
.8389
0.9
1.0
.8413
.8438
.8461
.8485
8508
.8531
.8554
.8577
.8599
.8621
1.0
1.1
.8643
8665
.8686
.8708
.8729
.8749
.8770
.8790
.8810
.8830
1.1
1.2
.8849
.8869
.8888
.8907
.8925
.8944
.8962
.8980
.8997
.9015
1.2
13
9032
9049
906
9082
9099
9115
9131
9147
9162
9177
13
Transcribed Image Text:Standard normal distribution table (page 1)
NEGATIVE z Scores
Standard Normal (z) Distribution: Cumulative Area from the LEFT
.00
.01
.02
.03
.04
.05
.06
.07
.08
.09
-3.50 and
.0001
-3.50 and
lower
lower
-3.4
.0003
.0003
.0003
.0003
.0003
.0003
.0003
.0003
.0003
.0002
-3.4
-3.3
.0005
.0005
.0005
.0004
.0004
.0004
.0004
.0004
.0004
.0003
-3.3
-3.2
.0007
.0007
.0006
.0006
.0006
.0006
.0006
.0005
.0005
.0005
-3.2
-3.1
.0010
.0009
.0009
.0009
.0008
.0008
.0008
.0008
.0007
.0007
-3.1
-3.0
.0013
.0013
.0013
.0012
.0012
.0011
.0011
.0011
.0010
.0010
-3.0
-2.9
.0019
.0018
.0018
.0017
.0016
.0016
.0015
.0015
.0014
.0014
-2.9
-2.8
.0026
.0025
.0024
.0023
.0023
.0022
.0021
.0021
.0020
.0019
-2.8
-2.7
.0035
.0034
.0033
.0032
.0031
.0030
.0029
.0028
.0027
.0026
-2.7
-2.6
.0047
.0045
.0044
.0043
.0041
.0040
.0039
.0038
.0037
.0036
-2.6
-2.5
.0062
.0060
.0069
.0067
.0055
.0054
.0052
.0051
.0049
.0048
-2.5
-2.4
.0082
.0080
.0078
.0075
.0073
.0071
.0069
.0068
.0066
.0064
-2.4
-2.3
.0107
.0104
.0102
.0099
.0096
.0094
.0091
.0089
.0087
.0084
-2.3
Expert Solution
This question has been solved!
Explore an expertly crafted, step-by-step solution for a thorough understanding of key concepts.

This is a popular solution!

Trending now
This is a popular solution!

Step by step
Solved in 2 steps with 1 images

Recommended textbooks for you
MATLAB: An Introduction with Applications
Statistics
ISBN:
9781119256830
Author:
Amos Gilat
Publisher:
John Wiley & Sons Inc

Probability and Statistics for Engineering and th…
Statistics
ISBN:
9781305251809
Author:
Jay L. Devore
Publisher:
Cengage Learning

Statistics for The Behavioral Sciences (MindTap C…
Statistics
ISBN:
9781305504912
Author:
Frederick J Gravetter, Larry B. Wallnau
Publisher:
Cengage Learning
MATLAB: An Introduction with Applications
Statistics
ISBN:
9781119256830
Author:
Amos Gilat
Publisher:
John Wiley & Sons Inc
Probability and Statistics for Engineering and th…
Statistics
ISBN:
9781305251809
Author:
Jay L. Devore
Publisher:
Cengage Learning
Statistics for The Behavioral Sciences (MindTap C…
Statistics
ISBN:
9781305504912
Author:
Frederick J Gravetter, Larry B. Wallnau
Publisher:
Cengage Learning

Elementary Statistics: Picturing the World (7th E…
Statistics
ISBN:
9780134683416
Author:
Ron Larson, Betsy Farber
Publisher:
PEARSON

The Basic Practice of Statistics
Statistics
ISBN:
9781319042578
Author:
David S. Moore, William I. Notz, Michael A. Fligner
Publisher:
W. H. Freeman

Introduction to the Practice of Statistics
Statistics
ISBN:
9781319013387
Author:
David S. Moore, George P. McCabe, Bruce A. Craig
Publisher:
W. H. Freeman