Does the boxplot represent the information given in the histogram? ◇ No, the boxplot should be skewed left ◇ No, the median should be in the middle of the box ◇ No, the left whisker should extend to zero No, the right whisker should extend to 60 ○ Yes The time, in seconds, it takes a random sample of 30 dogs to perform a specific trick is displayed in the histogram. Number of Dogs 12 11 10 2 2 7 2 0-5 6-10 11-15 16-20 21-25 26-30 31-35 36-40 41-45 46-50 51-55 56-60 Time, seconds It was determined that the largest observation, 60 seconds, is an outlier, because Q3 + 1.5(Q3Q1) = 42 when rounded to the nearest whole number. A boxplot has been created. 05 ☐ 10 15 20 25 30 35 40 45 + 50 55 60 65 Time, seconds
Does the boxplot represent the information given in the histogram? ◇ No, the boxplot should be skewed left ◇ No, the median should be in the middle of the box ◇ No, the left whisker should extend to zero No, the right whisker should extend to 60 ○ Yes The time, in seconds, it takes a random sample of 30 dogs to perform a specific trick is displayed in the histogram. Number of Dogs 12 11 10 2 2 7 2 0-5 6-10 11-15 16-20 21-25 26-30 31-35 36-40 41-45 46-50 51-55 56-60 Time, seconds It was determined that the largest observation, 60 seconds, is an outlier, because Q3 + 1.5(Q3Q1) = 42 when rounded to the nearest whole number. A boxplot has been created. 05 ☐ 10 15 20 25 30 35 40 45 + 50 55 60 65 Time, seconds

Holt Mcdougal Larson Pre-algebra: Student Edition 2012
1st Edition
ISBN:9780547587776
Author:HOLT MCDOUGAL
Publisher:HOLT MCDOUGAL
Chapter11: Data Analysis And Probability
Section: Chapter Questions
Problem 8CR

Related questions
Question
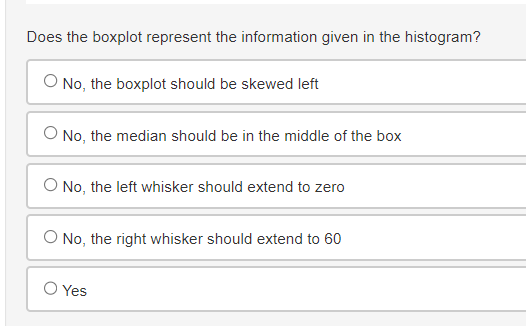
Transcribed Image Text:Does the boxplot represent the information given in the histogram?
◇ No, the boxplot should be skewed left
◇ No, the median should be in the middle of the box
◇ No, the left whisker should extend to zero
No, the right whisker should extend to 60
○ Yes

Transcribed Image Text:The time, in seconds, it takes a random sample of 30 dogs to perform a specific trick is displayed in the histogram.
Number of Dogs
12
11
10
2
2
7
2
0-5 6-10 11-15 16-20 21-25 26-30 31-35 36-40 41-45 46-50 51-55 56-60
Time, seconds
It was determined that the largest observation, 60 seconds, is an outlier, because Q3 + 1.5(Q3Q1) = 42 when rounded to the nearest whole number. A boxplot has been created.
05
☐
10
15 20
25
30 35
40
45
+
50 55
60
65
Time, seconds
Expert Solution
This question has been solved!
Explore an expertly crafted, step-by-step solution for a thorough understanding of key concepts.

This is a popular solution!

Trending now
This is a popular solution!

Step by step
Solved in 2 steps

Recommended textbooks for you
Holt Mcdougal Larson Pre-algebra: Student Edition…
Algebra
ISBN:
9780547587776
Author:
HOLT MCDOUGAL
Publisher:
HOLT MCDOUGAL

Big Ideas Math A Bridge To Success Algebra 1: Stu…
Algebra
ISBN:
9781680331141
Author:
HOUGHTON MIFFLIN HARCOURT
Publisher:
Houghton Mifflin Harcourt

Glencoe Algebra 1, Student Edition, 9780079039897…
Algebra
ISBN:
9780079039897
Author:
Carter
Publisher:
McGraw Hill
Holt Mcdougal Larson Pre-algebra: Student Edition…
Algebra
ISBN:
9780547587776
Author:
HOLT MCDOUGAL
Publisher:
HOLT MCDOUGAL
Big Ideas Math A Bridge To Success Algebra 1: Stu…
Algebra
ISBN:
9781680331141
Author:
HOUGHTON MIFFLIN HARCOURT
Publisher:
Houghton Mifflin Harcourt
Glencoe Algebra 1, Student Edition, 9780079039897…
Algebra
ISBN:
9780079039897
Author:
Carter
Publisher:
McGraw Hill