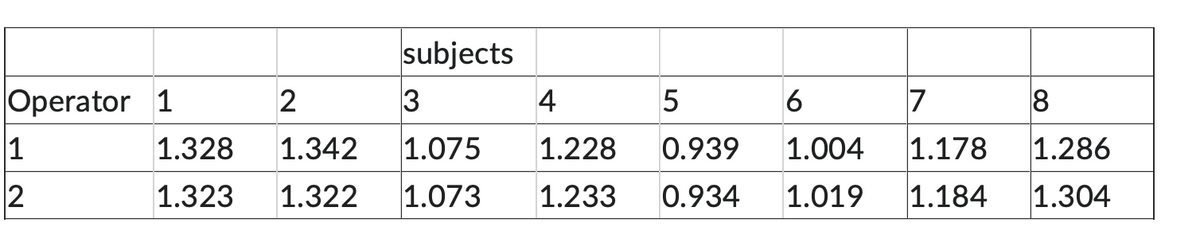
The total body bone mineral content is a measure of bone health. Two operators were assigned to collect measurements on the same individuals in a paired experiment. The results below were obtained. Test at the 5% significance level the null hypothesis that the two operators have the same mean against the alternative that the means are different. The value of the test statistic and the decision are


Q: In an avocado exporting country there is an undesirable disease in avocados. He decides to take a…
A: From the provided information, Sample size (n) = 1000 From which 204 were infected avocados.…
Q: Suppose 42% of recent college graduates plan on pursuing a graduate degree. Eighteen recent college…
A:
Q: 5. Suppose that the age of a randomly selected business major can be considered to be a random…
A: We have given the following information Mean = 20 Standard deviation = 2 And n = 64
Q: The population mean and standard deviation are given below. Find the required probability and…
A: Given data: Sample size, n = 63 Population mean, μ=22 Population standard deviation, σ=1.29 Required…
Q: Directions. Test the significance of the following correlation coefficients. 3. -0.58 4. 0.63 5.…
A: To test the significance of the correlation, we state hypothesis. H0: There is no significant…
Q: A marketing manager conducted a study to determine the…
A: Given Information: Intercept = 104.062 Slope = 50.730 R-squared value is 0.8340
Q: A standard deck of cards is being used to play a game. There are four suits (hearts, diamonds,…
A: Given that, A standard deck of cards is being used to play a game. There are four suits (hearts,…
Q: sample of size 86 will be drawn from a population with mean 90 and standard deviation 24. Use the…
A: Given that Population Mean =90 Population standard deviation =24 Sample size =86 we have find…
Q: A light bulb manufacturer wants to compare the mean lifetimes of two of its light bulbs, model A and…
A:
Q: marketing research company is estimating which of two soft drinks college students prefer. A random…
A: Given that Sample size n =110 95% confidence interval. (0.46 , 0.93)
Q: (a) From the regression equation, what is the predicted sleep time (in hours) when the GAS score is…
A: It is given that the GAS score represented by x and the number of hours of sleep last night…
Q: Each experiment compares three treatment conditions, and each experiment uses separate samples of n…
A: Given data Experiment A treatment 1 2 3 M=1 M=2 M=3 s=10…
Q: Let X be a random variable with the following probability distribution. Value X of X P(X=x) 30…
A: Given that Probability mass function of X is Value x 30 40 50 60 70 80 P(X=x) 0.15 0.25 0.20…
Q: a. In 100 workers, there are 30 men and 70 women. The average monthly income form men is 32,000, and…
A: Since you have asked multiple question, we will solve the first question for you. If you want any…
Q: What is the P VALUE? H(0) P= .68 H(A) P> .68 Sample size of 46. 63 People were surveyed. 48…
A: Given: P = 0.68 It is given that, 63 people were surveyed in which 48 voted YES, and 15 voted NO. X…
Q: Data was collected at a tennis court. It showed that being older implies that a player will stay for…
A:
Q: The semarnat has set the average number of bacteria per cm3 of water at 70, as a limit. An average…
A: sample mean x=∑xi1nn x=(69+74+75+70+72+73+71+73+68)9 x=6459 x=71.67 Sample Variance s2=∑xi-xn-1…
Q: (a) Below are the prices of chicken (normal), chicken (kampung) and mutton for the year 2012 and…
A: Paasche's quantity index is given by, Q01P= (Σq1p1/Σq0p1)*100 Laspeyre's Price index is given by,…
Q: The BLS uses sampling for its National Compensation Survey to report employment costs. In its second…
A:
Q: have taken twenty different leaves ar The leaves were divided into four gro on measured 15, 30, 45,…
A: The assumption that variances are equal between groups is tested using Hartley's Fmax test. As long…
Q: Find the variance for a Bernoulli distribution whose parameter is 0 = 0.81. Your answer should be to…
A:
Q: In a poll, 51% of the people polled answered yes to the question "Are you in favor of the death…
A: The following information has been provided: p^=0.51E=0.03 The level of significance is : α=1-0.94…
Q: Directions. Test the significance of the following correlation coefficients. 3. -0.58 4. 0.63 5.…
A: Hypotheses: H0: ρ=0H1: ρ≠0
Q: A sample of size 86 will be drawn from a population with mean 90 and standard deviation 24. Use the…
A: Solution:- from given information sample size n=86 mean μ=90Standard deviation σ=24
Q: Based on the firm's data and the regression line, complete the following. A. For these data, values…
A: The slope is 0.19 and it is positive.
Q: 7.53 Chapter 7: Section Exercises College Athletics A recent Monmouth University poll found that 675…
A: Concept: Confidence interval give you lower and upper bound value under certain confidence level,for…
Q: Determine the null and alternative hypotheses. Choose the correct choice below.
A: The null hypothesis and alternate hypothesis: H0: The distribution of variables follows the given…
Q: In a regression analysis, if the sum of squares ERROR is 280 and the sum of squares REGRESSION is…
A: Given;the sum of squares ERROR(SSE) = 280the sum of squares REGRESSION (SSR) =370
Q: A multiple choice quiz has 5 questions, each one of the first three questions has four possible…
A:
Q: Hi, What do I need to change so I see eight bars instead of only 7?
A: The histogram you got The histogram which you got, suggest that you have 7 rows of data entered in…
Q: plot shows the sizes and annual rents of some es in the downtown area of a city. SIZE AND ANNUAL…
A: We have given A scatter plot between the cost of rent and the size of the office spaces. Rent…
Q: The local seven-digit telephone numbers in city A have 334 as the first three digits. How many…
A:
Q: A regression was run to determine if there is a relationship between hours of TV watched per day (x)…
A: The following information has been given: x→hours of TV watched per day. y→number of sit ups a…
Q: Hantavirus is carried by wild rodents and causes severe lung disease in humans. A recent study on…
A: The precipitation accounted for 79% of the variation in prevalence.
Q: It is often said that the criminal sentences given to minority offenders are more severe than those…
A:
Q: Over the past 5 years, U.S. airlines average about 1 fatality per month (U.S. Department of…
A: Given: Meanμ=1 Consider, X be the random variable that follows the Poisson distribution with the…
Q: A university surveyed recent graduates of the English department for their starting salaries. One…
A:
Q: A child psychologist is interested in whether a new reading program results in a larger improvement…
A:
Q: financial magazine conducted a survey. It showed that a person with more years of education tends to…
A: Concept: Correlation measures degree of correlation between two variables. Note : According to…
Q: A standard deck of cards is being used to play a game. There are four suits (hearts, diamonds,…
A:
Q: A. For which data set is the sample correlation coefficient r closest to −1? B. For which data set…
A:
Q: Directions. Given the value of r, describe the relationship in terms of strength and direction. 1. r…
A: Followings are the Explanation of the question Correlation :- Correlation is a defined as a…
Q: The monthly utility bills in a city are normally distributed, with a mean of $100 and a standard…
A:
Q: Statistics students in Oxnard College sampled 10 textbooks in the Condor bookstore and recorded the…
A: Given information- We have given that a statistics student in Oxnard college sampled 10 textbooks in…
Q: A standardized exam's scores are normally distributed. In a recent year, the mean test score was…
A: z score is given is given as z=X-μσ z score takes value from -3 to 3 with probability area of…
Q: 1. Answer the following related to the chi-square goodness of fit test: a. The chi-square goodness…
A: Here, we need to identify the suitable answers for the given questions.
Q: (a) A flute instructor examined student progress. She found that playing a longer song does not…
A: Correlation is a statistical measure that indicates the extent to which two or more variables…
Q: Verbal SAT as a Predictor of GPA A scatterplot with regression line is shown below for a regression…
A: Hi! Thank you for the question, As per the honor code, we are allowed to answer three sub-parts at a…
Q: My options are 1,2,3,4,5,6,7,8,9. What should i Put?
A:
Q: A political candidate has asked you to conduct a poll to determine what percentage of people support…
A: Given that Margin of error =E =2%=0.02 95% confidence.
The total body bone mineral content is a measure of bone health. Two operators were assigned to collect measurements on the same individuals in a paired experiment. The results below were obtained. Test at the 5% significance level the null hypothesis that the two operators have the same mean against the alternative that the means are different. The value of the test statistic and the decision are

Step by step
Solved in 3 steps with 3 images

- You work at a bank and are asked to recommend the amount of cash to put in an ATM each day. You don't want to put in too much (security) or too little (customer irritation). 52, 89, 71, 59, 63, 75, 76, 90, 85, 69, 72, 67, 59, 62, 70, 66, 65, 72, 66, 77, 65, 71, 66, 67, 76, 69, 74, 61, 79, 71 If you put $7650 in the ATM each day, what percent of the days in a month should you expect to run out of cash?Date DJIA S&P 500 January 6 12,360 1,278 January 13 12,422 1,289 January 20 12,720 1,287 January 27 12,660 1,234 February 3 12,862 1,267 February 10 12,801 1,243 February 17 12,950 1,262 February 24 12,983 1,313 March 2 12,978 1,255 March 9 12,922 1,371 March 16 13,233 1,404 March 23 13,081 1,397 March 30 13,212 1,408 April 5 13,060 1,398 April 13 12,850 1,3704. The number of passengers (in thousands) for the leading U.S. passenger airlines in 2004 is indicated below. 91,570 86,755 81,066 70,786 55,373 42,400 40,551 21,119 16,280 14,869 13,659 13,417 13,170 12,632 11,731 10,420 10,024 9,122 7,041 6,954 6,406 6,362 5,930 5,585 5,427• Use the data to construct a grouped frequency distribution and a cumulative frequency distribution with a reasonable number of classes and comment on the shape of the distribution using graph.
- A small dealership leased 21 Suburu Outbacks on 2-year leases. When the cars were returned at the end of the lease, the mileage was recorded (see below). 40,010 24,996 14,340 17,359 44,712 44,525 20,239 33,348 24,299 41,782 58,313 35,886 25,765 28,937 25,069 43,302 23,958 43,526 53,617 31,803 36,704 (a) Is the dealer's mean significantly greater than the national average of 29,393 miles for 2-year leases? Using the 10 percent level of significance, choose the appropriate hypothesis. H0: μ ≤ 29,393 miles vs. H1: μ > 29,393 miles, reject H0 if tcalc > 1.3250 H0: μ ≥ 29,393 miles vs. H1: μ > 29,393 miles, reject H0 if tcalc > 1.3250 H0: μ ≤ 29,393 miles vs. H1: μ < 29,393 miles, reject H0 if tcalc > 1.3250 H1: μ ≤ 29,393 miles vs. H0: μ > 29,393 miles, reject H0 if tcalc > 1.3250 b) Calculate the test statistic. (Round your answer to 2 decimal places.) Test statisticMale Female27,329 22,49814,596 24,5893,890 5,06827,315 16,72525,067 10,3808,480 16,57219,490 10,75516,334 19,12228,183 11,82721,356 18,61212,674 15,73210,066 11,42311,288 17,79220,679 24,76719,722 6,359369 19,57118,284 21,81211,653 19,68618,981 18,29415,412 13,48515,839 31,24320,391 9,4316,069 16,1216,072 4,22624,527 12,6649,492 20,22511,618 14,59813,916 22,04613,081 20,08517,460 11,13913,491 35,7097,630 8,54121,263 9,82216,455 12,38511,590 28,05515,409 19,22816,827 16,21710,596 17,72618,005 20,00612,428 16,58313,727 19,8574,706 14,49917,168 17,97412,641 17,22015,661 28,75616,855 38,40718,490 25,78537,993 33,38319,196 25,06447,688 30,26225,062 18,14310,357 7,59515,653 23,8969,962 16,4425,377 16,53619,537 26,129ɪɪ. ᴅᴇᴛᴇʀᴍɪɴᴇ ᴡʜᴇᴛʜᴇʀ ᴛʜᴇ ɪɴᴛᴇɢᴇʀꜱ ɪɴ ᴇᴀᴄʜ ᴏꜰ ᴛʜᴇꜱᴇ ꜱᴇᴛꜱ ᴀʀᴇ ᴘᴀɪʀᴡɪꜱᴇ ʀᴇʟᴀᴛɪᴠᴇʟʏᴘʀɪᴍᴇ.₆. ₁₁, ₁₅, ₁₈₇. ₁₄, ₁₅, ₂₂₈. ₁₂, ₁₇, ₃₁, ₃₇,₅₁₉. ₇, ₉, ₁₀, ₁₃₁₀. ₁₄, ₁₇, ₈₅
- A: $29,900$29,900, $29,200$29,200, $26,100$26,100, $39,300$39,300, $24,200$24,200, $37,300$37,300, $34,300$34,300, $29,700$29,700, $35,100$35,100, $21,100$21,100, $38,800$38,800, $25,100$25,100, $27,200$27,200, $29,100$29,100 B: 3.423.42, 3.533.53, 4.414.41, 3.953.95, 3.183.18, 4.854.85, 3.133.13, 4.234.23, 3.533.53, 4.724.72, 3.24 What are the coefficent variables of each set?b. In a manufacturing unit for electronic chips, Unit manufactures chips that are either defective (10%), normal (82%), or slightly defective (8%). The produced chip is passed through an automated inspection system which can detect and discard any chip which is obviously defective. What is the quality of the chip that makes it through the inspection machine?Following are the quantities and prices for the years 2010 and 2018 for Kinzua Valley Geriatrics. Use 2010 as the base period. 2010 2018ItemPriceQuantity PriceQuantitySyringes (dozen)$6.94 1,332 $6.18 1,957 Thermometers 8.32 5 16.38 15 Advil (bottle) 4.69 283 8.89 295 Patient record forms (box) 6.19 924 9.82 1,027 Copier paper (box) 10.48 55 25.96 81 %media:2excel.ext% Click here for the Excel Data File a. Determine the simple price indexes. (Round your answers to 2 decimal places.) b. Determine the simple aggregate price index for the two years. (Round your answer to 2 decimal places.) c. Determine the Laspeyres price index. (Round your answer to 2 decimal places.) d. Determine the Paasche price index. (Round your answer to 2 decimal places.) e. Determine Fisher's ideal index. (Round your answer to 2 decimal places.).
- Commercial Residential4.17 9.795.38 5.973.22 8.095.42 5.814.91 8.552.59 3.973.53 8.113.01 8.664.69 10.356.17 6.980.33 5.675.13 4.056.35 6.156.47 9.853.98 5.6772% of Americans said that they plan to travel in 2021, and 9% of those who plan to travelintend to take an international trip. What percentage of Americans plan to take aninternational trip in 2021?Calculate the point prevalence for Alzheimer’s disease among individuals 65 years of age or older in a county that has 200,000 individuals who are 65 years of age or older, if 22,223 individuals who are 65 years of age or older have the disease. 0.0111 0.1111 0.8889 0.9889