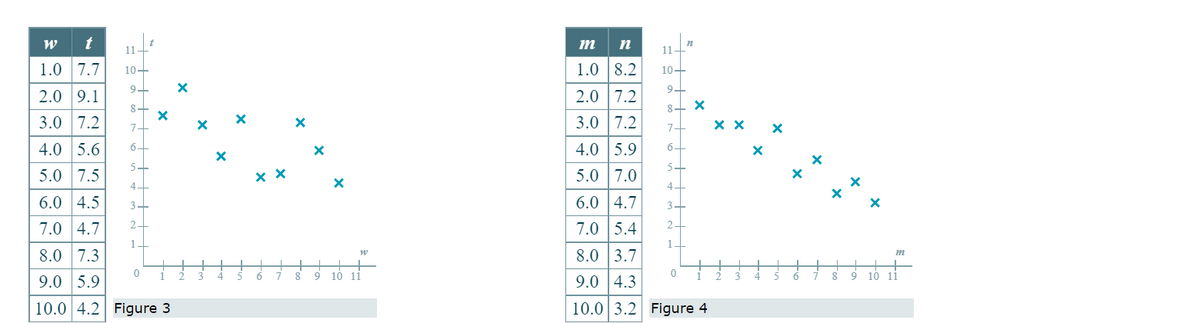
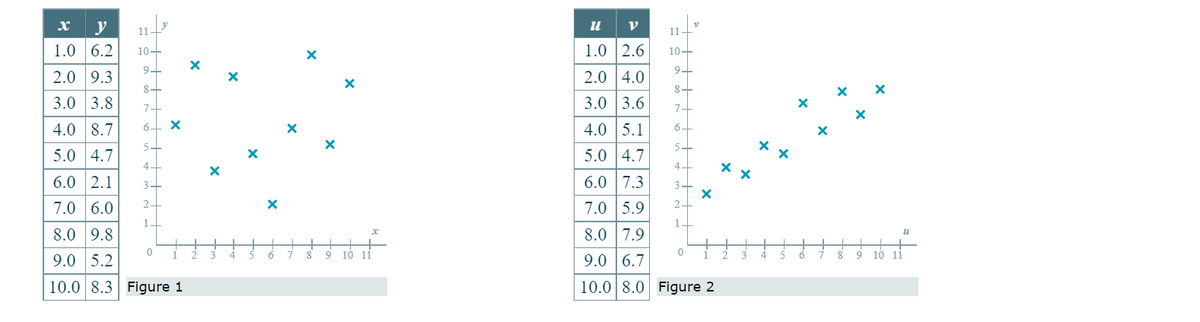
A. For which data set is the sample correlation coefficient r closest to −1? B. For which data set is the sample correlation coefficient r closest to 0? C. For which data set is the sample correlation coefficient r equal to 1?
Q: The joint density function for random variables X and Y is f(x, y). Find the conditional mean and…
A:
Q: The BLS uses sampling for its National Compensation Survey to report employment costs. In its second…
A:
Q: Hi, What do I need to change so I see eight bars instead of only 7?
A: The histogram you got The histogram which you got, suggest that you have 7 rows of data entered in…
Q: rue of False? As the sample size of randomly selected samples increases, the distribution of the…
A: The statement is given.
Q: From the parameter estimation output, which of the following is TRUE? Intercept Diameter of granules…
A: It is given that Y-intercept = -2.47 Slope = 17.16
Q: Every year, the students at a school are given a musical aptitude test that rates them from 0 (no…
A: Given data is Aptitude score Frequency 0 3 1 5 2 4 3 3 4 2 5 3
Q: A study is conducted in which people were asked whether they agreed or disagreed with the statement…
A: Given data: HS Some College Total Agree 364 166 198 728 Disagree 556 469 791 1816 Don't…
Q: The following estimated regression equation relating sales to inventory investment and advertising…
A:
Q: Which of the following is TRUE? I. II. |||. O a. O b. O c. O d. In a good regression model, the…
A:
Q: tandard deviation of $1995. Is there enough evidence to reject the claim at a = 0.01? Complete parts…
A: A random sample of 22 vehicles has mean price 20634 and standard deviation is 1995…
Q: A study was done on smoking and lung capacity. 200 smokers took part in a study that asked them how…
A:
Q: Based on the information above and your values fort 95% Confidence Interval for the relative risk?…
A: The likelihood that an event will occur in a treatment group as opposed to a control group is…
Q: The following shows incomplete ANOVA output: ANOVA Regression Residual Total Calculate: P= 1 df 1 8…
A: Given that dfRegression = 1 , dfResidual = 8 , dfTotal = 9 SSTotal = 2335 , MSResidual = 140.1…
Q: 3. A psychologist is studying the effects of lack of sleep on the performance of various…
A: According to the given information in this question We need to find p value and conclusion
Q: What is the number of samples?
A: It is given that Sample size for January = 100 Sample size for March = 100 Sample size for June =…
Q: 3. A psychologist is studying the effects of lack of sleep on the performance of various…
A: The following information has been provided: x¯=1.82n=36s=0.22 The level of significance is:…
Q: ial distribution is the same in at least two of the four regions. Ha: The racial distribution is…
A: Given: White Black Other Total Northeast 93 14 8 115 Midwest 121 19 7 147 South 161 36…
Q: gh-rent district: The mean monthly rent for a one-bedroom apartment without a doorman in Manhattan…
A: Given that. X~N( μ , ?^2 ) μ=2544 , ?=483 Z-score =( x - μ )/?
Q: Let f(x) be the height of a maple tree in inches and the number of years since 2000. A linear model…
A: Given equation f(x ) = 9.44x +84.182 (A ) Given x=11 then f(x)= ? ( B ) Given f(x) =246 then x = ?
Q: Using your favorite statistics software package, you generate a scatter plot with a regression…
A: Given,y=-45.79x+74.67and the r=-0.773
Q: What is the P VALUE? H(0) P= .68 H(A) P> .68 Sample size of 46. 63 People were surveyed. 48…
A: Given: X = 48 n = 63 P = 0.68 Formula Used: p-value = P(Z≥z) Z = p^-PP(1-P)n p^ = Xn
Q: According to a study done by UCB students, the height for Martian adult males is normally…
A: Given,mean(μ)=65standard deviation(σ)=2.3
Q: Find the present value PV of the annuity account necessary to fund the withdrawal given. (Assume…
A: Given: P=$2,300r=4%=0.04 annuityn=12×15=180
Q: sample of size 86 will be drawn from a population with mean 90 and standard deviation 24. Use the…
A: Given that Population Mean =90 Population standard deviation =24 Sample size =86 we have find…
Q: The length of time taken on the SAT for a group of students…
A:
Q: A regression was run to determine if there is a relationship between hours of TV watched per day (x)…
A:
Q: 9. Brooke Henderson of the LPGA, who just won her second major last weekend, played a round of golf…
A: GivenMean(μ)=21.4standard deviation(σ)=16.6
Q: Find the complete possible outcomes and values of the given situation. Use table to represent the…
A: Outcome is the result of an trail. Possible outcome is the all the outcome that involve in the…
Q: Answer the following to summarize the test of the hypothesis that there is no relationship between…
A: Given: Significance level α=0.10 Null Hypothesis H0: There is no relationship between students'…
Q: You wish to test the following claim (Ha) at a significance level of a = 0.10. Ho:μ = 76.3 Ha: μ <…
A: Given : To test : Ho:μ=76.3 VS Ha:μ<76.3 This is left tailed test Population is…
Q: A 28-year-old man pays $200 for a one-year life insurance policy with coverage of $174787. If the…
A:
Q: A random selection of volunteers at a research institute has been exposed to a weak flu virus. After…
A: Given data is :
Q: (b) A random sample of enrollments from selected 6 business schools in London that specializes in…
A: Given data: Finance Marketing 574 892 477 913 601 843 498 1002 598 907 547 785
Q: 54. If the sum of the squares of five numbers is 165 and their variance is 8. What is the mean of…
A: Given: Sum of squares of 5 numbers is 165 Variance is 8 Required: To find the mean of the numbers.
Q: A brochure claims that the average maximum height a certain type of plant is 0.7 m. A gardener…
A: Given that Sample size=43 Sample mean=0.65 Population mean=0.7 Population standard deviation=0.2…
Q: For this problem, carry at least four digits after the decimal in your calculations. Answers may…
A: From the provided information, Sample size (n) = 69 From which 36 were extroverts that is x = 36
Q: A regression was run to determine if there is a relationship between hours of study per week (x) and…
A: Given that y=ax+b a = 5.235 b = 21.73 r ^2 = 0.36 r = 0.6
Q: K A researcher wishes to estimate, with 90% confidence, the population proportion of adults who…
A: Given that Margin of error =E =2%=0.02 90% confidence interval.
Q: Compare the standard deviation of a data set when removing an outlier. An outlier is an extreme…
A:
Q: uppose you do a study of acupuncture to determine how effective it is in relieving pain. You measure…
A: The given data is 8.6; 9.4; 7.9; 6.8; 8.3; 7.3; 9.2; 9.6; 8.7; 11.4; 10.3; 5.4; 8.1; 5.5; 6.9
Q: 6. The following sample contains the scores of 6 students selected at random in Mathematics and…
A:
Q: Assume there are four individuals to be tested in Covid-19. Assume that E is a random variable that…
A: Discrete probability distribution
Q: 2) Determine the critical value(s) of the test statistic for each of the following small samples…
A: Hey there! Thank you for posting the question. Since your question has more than 3 parts, we are…
Q: A consumer affairs agency wants to check the average weight of a new product on the market. A random…
A: Given data: class boundaries frequency 74- 77 3 77- 80 6 80- 83 9 83-86 3 86- 89 4
Q: There are 26 letters in the English alphabet. Letters are picked one by one
A: Given: Total number of letters = 26 Number of letters picked = 6
Q: Salaries of 45 college graduates who took a statistics course in college have a mean, x, of $68,500.…
A:
Q: e out those numbers for each month?
A: Advertisement Sales MARCH 900 56000 APRIL 2700 89000 MAY 3150 98500 JUNE 1300 54000 JULY…
Q: Directions. Test the significance of the following correlation coefficients. 3. -0.58 4. 0.63 5.…
A: 3) The correlation coefficient is -0.58.
Q: If the equation of the regression line that relates income in dollars of student's parents, x, with…
A: Given datay=8000+0.02x
Q: The test scores for the analytical writing section of a particular standardized test can be…
A: Given: μ = 3.2 σ = 0.86 Formula used: X = μ + Zσ
A. For which data set is the sample
B. For which data set is the sample correlation coefficient r closest to 0?
C. For which data set is the sample correlation coefficient r equal to 1?
Trending now
This is a popular solution!
Step by step
Solved in 2 steps with 2 images
- Find the positive geometric mean between 4 and 64.x y 1.0 10.0 2.0 9.0 3.0 8.0 4.0 7.0 5.0 6.0 6.0 5.0 7.0 4.0 8.0 3.0 9.0 2.0 10.0 1.0 y 1 2 3 4 5 6 7 8 9 10 11 x 1 2 3 4 5 6 7 8 9 10 11 0 Figure 1 u v 1.0 7.7 2.0 5.4 3.0 10.3 4.0 6.3 5.0 2.2 6.0 4.9 7.0 8.7 8.0 3.5 9.0 9.4 10.0 6.9 v 1 2 3 4 5 6 7 8 9 10 11 u 1 2 3 4 5 6 7 8 9 10 11 0 Figure 2 w t 1.0 3.1 2.0 4.3 3.0 3.6 4.0 5.3 5.0 4.7 6.0 7.0 7.0 6.2 8.0 7.6 9.0 6.9 10.0 8.4 t 1 2 3 4 5 6 7 8 9 10 11 w 1 2 3 4 5 6 7 8 9 10 11 0 Figure 3 m n 1.0 7.2 2.0 9.1 3.0 7.1 4.0 5.4 5.0 7.7 6.0 5.0 7.0 4.3 8.0 6.7 9.0 6.1 10.0 4.4 n 1 2 3 4 5 6 7 8 9 10 11 m 1…Hours Spent in Child Care 7.5 1.8 0.9 8.0 5.2 6.1 3.3 1.0 4.4 1.6 5.2 11.5 11.6 10.1 9.0 7.3 2.2 1.0 5.2 10.7 7.6 4.1 10.1 6.0 10.1 9.9 10.4 7.0 3.8 9.6 4.1 7.2 4.0 8.5 6.0 7.3 5.4 11.5 9.1 6.5
- x y 1.0 3.6 2.0 4.1 3.0 3.6 4.0 5.3 5.0 4.4 6.0 6.8 7.0 5.7 8.0 7.8 9.0 6.7 10.0 7.8 y 1 2 3 4 5 6 7 8 9 10 11 x 1 2 3 4 5 6 7 8 9 10 11 0 Figure 1 u v 1.0 7.8 2.0 8.7 3.0 6.8 4.0 5.6 5.0 8.3 6.0 5.2 7.0 4.2 8.0 7.0 9.0 6.1 10.0 3.5 v 1 2 3 4 5 6 7 8 9 10 11 u 1 2 3 4 5 6 7 8 9 10 11 0 Figure 2 w t 1.0 6.9 2.0 9.5 3.0 3.8 4.0 9.0 5.0 5.0 6.0 2.3 7.0 5.9 8.0 10.2 9.0 4.8 10.0 7.6 t 1 2 3 4 5 6 7 8 9 10 11 w 1 2 3 4 5 6 7 8 9 10 11 0 Figure 3 m n 1.0 7.8 2.0 7.1 3.0 8.0 4.0 5.9 5.0 7.4 6.0 4.5 7.0 5.2 8.0 3.7 9.0 4.1 10.0 3.5 n 1 2 3 4 5 6 7 8 9 10 11 m 1 2…Price($) W Price ($) A $3.98 $3.99 $2.28 $3.49 $3.08 $5.29 $0.58 $0.60 $2.00 $1.77 $8.98 $10.49 $3.94 $3.99 $3.50 $5.49 $1.50 $0.99 $2.18 $2.29 $3.88 $3.19 $2.78 $2.99 $2.12 $1.00 $0.88 $0.59 $2.64 $2.79 $0.98 $1.99 $0.98 $1.00 $0.75 $1.00 $0.28 $0.29 $2.98 $3.99 $2.82 $2.79 $0.94 $1.19 $1.47 $1.25 $5.48 $4.99 $3.98 $3.99 $3.48 $3.79 $1.08 $1.89 $1.08 $1.00 $1.00 $1.50 $0.58 $0.50 Trying to determine if A is more expenive than W. Test Your Claim for Using a 2 Sample Hypothesis Test with a 5% Level of Significance. 1. Define µ1 and µ2 2. Determine the null and alternate hypothesis and identify the claim. 3. Using technology find the test statistic and interpret it. 4. Make a decision of rejecting or failing to reject the null hypothesis. You can use the Classical Approach (using critical values) or the P-value Approach but you must thoroughly explain which method you used and walk me through your steps. 5. State your…In March 2015, Laclede Gas had the following rate schedule for natural gas usage in single-family residences.Monthly service charge $19.50Delivery chargeFirst 30 therms $0.91686/thermOver 30 therms $0Natural gas costFirst 30 therms $0.348/thermOver 30 therms $0.5922/therm(a) What is the charge for using 20 therms in a month?(b) What is the charge for using 150 therms in a month?(c) Develop a function that models the monthly charge C for x therms of gas.(d) Graph the function found in part (c).
- How do you figure out ABOUT how many oranges does each person get then find out how APPROXIMATELY how many oranges everyone gets?Suppose a company charges a premium of $150 per year for an insurance policy for storm damage to roofs. Actuarial studies show that in case of a storm, the insurance company will pay out an average of $8000 for damage to a composition shingle roof and an average of $12,000 for damage to a shake roof. They also determine that out of every 10,000 policies, there are 7 claims per year made on composition shingle roofs and 11 claims per year made on shake roofs. What is the company’s expected value (i.e., expected profit) per year of a storm insurance policy? What annual profit can the company expect if it issues 1000 such policies? Determine the probability of a composition shingle roof claim out of 10,000 = ______ Determine the probability of a shake roof claim out of 10,000 = ______ How many claims are made out of 10,000? = _______ What is the probability of no claims out of 10,000? = _______ How much does each shingle roof claim cost the company, don’t forget each person pays $150…⎢10001000−6⎤⎦⎥X=⎡⎣⎢−2−82−468−610−9⎤⎦⎥[10001000−6]X=[−2−4−6−861028−9]. X=X= ⎡⎣⎢⎢⎢⎢⎢⎢[⎤⎦⎥⎥⎥⎥⎥⎥] f. ⎡⎣⎢001010100⎤⎦⎥X=⎡⎣⎢−79−5−21−4−1029⎤⎦⎥[001010100]X=[−7−2−10912−5−49]. X=X= ⎡⎣⎢⎢⎢⎢⎢⎢[⎤⎦⎥⎥⎥⎥⎥⎥] g. ⎡⎣⎢10001−5001⎤⎦⎥X=⎡⎣⎢2−2210−68−1−45⎤⎦⎥[1000100−51]X=[210−1−2−6−4285]. X=X= ⎡⎣⎢⎢⎢⎢⎢⎢[⎤⎦⎥⎥⎥⎥⎥⎥
- 2. The cost, in millions of dollars, of a 30-second TV ad during the Super Bowl from 2015 to 2019 can be approximated by ?(?) = −0.139?2 + 0.788? + 4.24 (million $), where ? is the number of years since 2015.What was the average cost of a Super Bowl ad during the given period?y x1 x2 x3 x40.8 44711 739 586 7.41.6 27896 690 526 12.51.5 25435 728 566 29.61.4 31889 549 338 22.61.1 37503 931 825 19.61.4 32822 678 506 7.81.9 22833 923 820 10.70.9 36000 822 677 33.71.6 23497 405 146 23.31.7 25285 678 506 13.5An environmentalist wants to find out the fraction of oil tankers that have spills each month. Step 1 of 2: Suppose a sample of 261 tankers is drawn. Of these ships, 46 had spills. Using the data, estimate the proportion of oil tankers that had spills. Enter your answer as a fraction or a decimal number rounded to three decimal places. Step 2 of 2: Suppose a sample of 261 tankers is drawn. Of these ships, 46 had spills. Using the data, construct the 90% confidence interval for the population proportion of oil tankers that have spills each month. Round your answers to three decimal places.