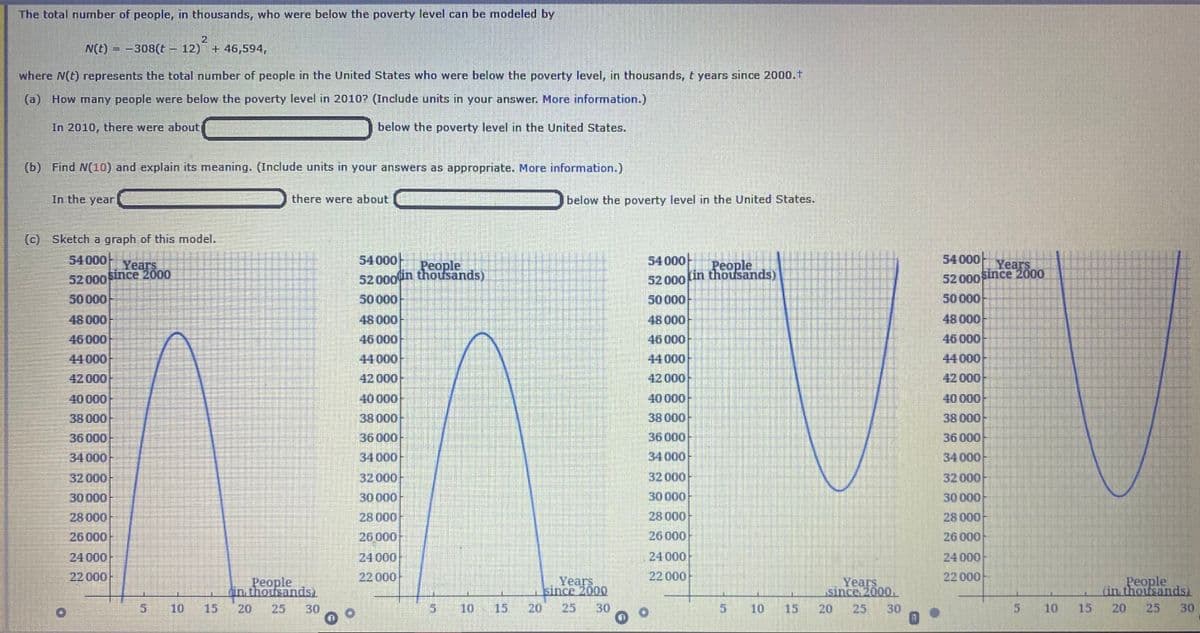
The total number of people, in thousands, who were below the poverty level can be modeled by 2 N(t) - -308(t – 12) + 46,594, where N(t) represents the total number of people in the United States who were below the poverty level, in thousands, t years since 2000.1 (a) How many people were below the poverty level in 2010? (Include units in your answer. More information.) In 2010, there were about below the poverty level in the United States. (b) Find N(10) and explain its meaning. (Include units in your answers as appropriate. More information.) In the year there were about below the poverty level in the United State (c) Sketch a graph of this model. 54 000- 54000- 54 000- Roonlo


Family of Curves
A family of curves is a group of curves that are each described by a parametrization in which one or more variables are parameters. In general, the parameters have more complexity on the assembly of the curve than an ordinary linear transformation. These families appear commonly in the solution of differential equations. When a constant of integration is added, it is normally modified algebraically until it no longer replicates a plain linear transformation. The order of a differential equation depends on how many uncertain variables appear in the corresponding curve. The order of the differential equation acquired is two if two unknown variables exist in an equation belonging to this family.
XZ Plane
In order to understand XZ plane, it's helpful to understand two-dimensional and three-dimensional spaces. To plot a point on a plane, two numbers are needed, and these two numbers in the plane can be represented as an ordered pair (a,b) where a and b are real numbers and a is the horizontal coordinate and b is the vertical coordinate. This type of plane is called two-dimensional and it contains two perpendicular axes, the horizontal axis, and the vertical axis.
Euclidean Geometry
Geometry is the branch of mathematics that deals with flat surfaces like lines, angles, points, two-dimensional figures, etc. In Euclidean geometry, one studies the geometrical shapes that rely on different theorems and axioms. This (pure mathematics) geometry was introduced by the Greek mathematician Euclid, and that is why it is called Euclidean geometry. Euclid explained this in his book named 'elements'. Euclid's method in Euclidean geometry involves handling a small group of innately captivate axioms and incorporating many of these other propositions. The elements written by Euclid are the fundamentals for the study of geometry from a modern mathematical perspective. Elements comprise Euclidean theories, postulates, axioms, construction, and mathematical proofs of propositions.
Lines and Angles
In a two-dimensional plane, a line is simply a figure that joins two points. Usually, lines are used for presenting objects that are straight in shape and have minimal depth or width.
1st graph.) A coordinate plane has "People (in thousands)" on the horizontal axis and "Years since 2000" on the vertical axis. The origin is at (0, 20000). The curve enters the window at approximately 1.8 on the positive horizontal axis, goes up and right becoming less steep, changes direction at the approximate point (10, 46600), goes down and right becoming more steep, and exits the window at approximately 18.2 on the positive horizontal axis.
2nd graph.) A coordinate plane has "Years since 2000" on the horizontal axis and "People (in thousands)" on the vertical axis. The origin is at (0, 20000). The curve enters the window at approximately 2.7 on the positive horizontal axis, goes up and right becoming less steep, changes direction at the approximate point (12, 46600), goes down and right becoming more steep, and exits the window at approximately 21.3 on the positive horizontal axis.
3rd graph.) A coordinate plane has "Years since 2000" on the horizontal axis and "People (in thousands)" on the vertical axis. The origin is at (0, 20000). The curve enters the window in the first quadrant, goes down and right becoming less steep, changes direction at the approximate point (22, 30600), goes up and right becoming more steep, and exits the window in the first quadrant.
4 th graph .) A coordinate plane has "People (in thousands)" on the horizontal axis and "Years since 2000" on the vertical axis. The origin is at (0, 20000). The curve enters the window in the first quadrant, goes down and right becoming less steep, changes direction at the point (20, 30000), goes up and right becoming more steep, and exits the window in the first quadrant.
![48 000
48 000
48 000
46 000
44 000
46 000
46 000
44 000
46 000
44 000
44 000
42 000
42 000
42 000
42 000
40 000
40 000
40000
40000
38000
38 000
38 000
38 000
36000
36 000
36 000
36 000
34000
34 000
34 000
34 000
32 000
32 000
32 000
32 000
30 000
30 000
30 000
30 000
28 000
28 000
28 000
26 000
26 000
26 000
26 000
24 000
24 000
24 000
24 000
22 000
22000
22 000
22000
People
in thousands,
30
Years
since 2000
Years
since 2000,
People
fin. thousands
10 15 20
25
5.
10
15
20
25
30
10
15
25
30
5.
10
15
20
25
30
(d) Estimate the vertex of this model and explain its meaning. (Include units in your answers as appropriate. More information. Round your second answer to the nearest thousand people.)
According to this model, in the year
there were about
below the poverty level in the United States which is a
-Select--
(e) Use your graph to estimate when the number of people in the United States below the poverty level was 43 million. (Round your answers to the nearest year.)
According to the graph, in about the year
(smaller value) and again in the year
(larger value) the number of people in the United States below the poverty level was 43
(f) If the domain for this model is [3, 18], find the range.
O [0, c0]
O [0, 46594]
O [31500, 46500]
O [21646, 46594]
O [3, 18]
20](/v2/_next/image?url=https%3A%2F%2Fcontent.bartleby.com%2Fqna-images%2Fquestion%2F35c28fdb-7a6d-4bfc-bcea-3e5968caf59d%2Fca2dd890-ba2a-4c69-97b0-e0d5e77d2397%2F731d6e_processed.jpeg&w=3840&q=75)


Trending now
This is a popular solution!

Step by step
Solved in 3 steps with 1 images


