The Toylot company makes an electric train with a motor that it claims will draw an average of only 0.8 ampere (A) under a normal load. A sample of nine motors was tested, and it was found that the mean current was x- 1.26 A, with a sample standard deviation of s- 0.44 A. Do the data indicate that the Toylot claim of 0.8 A is too low? (Use a 1% level of significance.) What are we testing in this problem? O single proportion O single mean (a) What is the level of significance? State the null and alternate hypotheses. O Hg: p = 0.8; H,: p+ 0.8 O Ho: H0.8; H: - 0.8 O Hại p 0.8; H: p- 0.8 O Hạ: M - 0.8; Hạ: M* 0.8 O Hạ: p - 0.8; H,:p > 0.8 O Hạ: H- 0.8; H: > 0.8 (b) What sampling distribution will you use? What assumptions are you making? O The standard normal, since we assume that x has a normal distribution with unknown e. O The Student's t, since we assume that x has a normal distribution with unknown a. O The Student's t, since we assume that x has a normal distribution with known a. O The standard normal, since we assume that x has a normal distribution with known a. What is the value of the sample test statistic? (Round your answer to three decimal places.) (c) Find (or estimate) the P.value. O P-value > 0.250 O 0.125 < P.value < 0.250 O 0.050 < P-value < 0.125 O 0.025 < P.value < 0.050 O 0.005 < P.value < 0.025 O P-value < 0.005
The Toylot company makes an electric train with a motor that it claims will draw an average of only 0.8 ampere (A) under a normal load. A sample of nine motors was tested, and it was found that the mean current was x- 1.26 A, with a sample standard deviation of s- 0.44 A. Do the data indicate that the Toylot claim of 0.8 A is too low? (Use a 1% level of significance.) What are we testing in this problem? O single proportion O single mean (a) What is the level of significance? State the null and alternate hypotheses. O Hg: p = 0.8; H,: p+ 0.8 O Ho: H0.8; H: - 0.8 O Hại p 0.8; H: p- 0.8 O Hạ: M - 0.8; Hạ: M* 0.8 O Hạ: p - 0.8; H,:p > 0.8 O Hạ: H- 0.8; H: > 0.8 (b) What sampling distribution will you use? What assumptions are you making? O The standard normal, since we assume that x has a normal distribution with unknown e. O The Student's t, since we assume that x has a normal distribution with unknown a. O The Student's t, since we assume that x has a normal distribution with known a. O The standard normal, since we assume that x has a normal distribution with known a. What is the value of the sample test statistic? (Round your answer to three decimal places.) (c) Find (or estimate) the P.value. O P-value > 0.250 O 0.125 < P.value < 0.250 O 0.050 < P-value < 0.125 O 0.025 < P.value < 0.050 O 0.005 < P.value < 0.025 O P-value < 0.005

MATLAB: An Introduction with Applications
6th Edition
ISBN:9781119256830
Author:Amos Gilat
Publisher:Amos Gilat
Chapter1: Starting With Matlab
Section: Chapter Questions
Problem 1P

Related questions
Question
HI could you fill out the blanks?
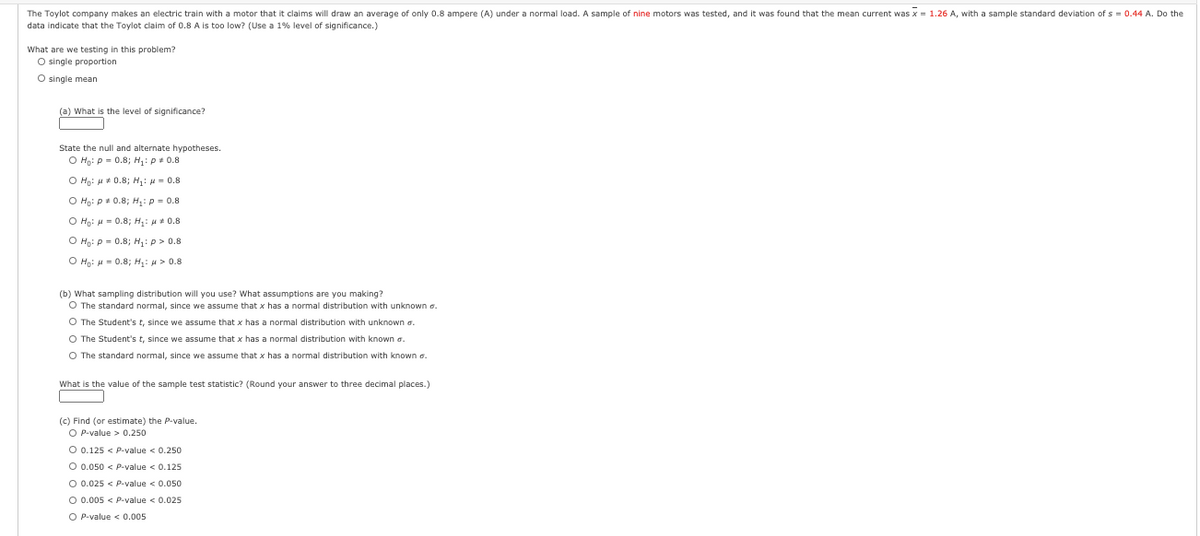
Transcribed Image Text:The Toylot company makes an electric train with a motor that it claims will draw an average of only 0.8 ampere (A) under a normal load. A sample of nine motors was tested, and it was found that the mean current was x = 1.26 A, with a sample standard deviation of s = 0.44 A. Do the
data indicate that the Toylot claim of 0.8 A is too low? (Use a 1% level of significance.)
What are we testing in this problem?
O single proportion
O single mean
(a) What is the level
significance?
State the null and alternate hypotheses.
O Ho: p = 0.8; H: p+ 0.8
O Ho: H* 0.8; H: - 0.8
O Hạ: p+ 0.8; H: p = 0.8
O Họ: u = 0.8; H: 4* 0.8
O Hạ: p = 0.8; H: p > 0.8
O Hạ: H = 0.8; H;: 4 > 0.8
(b) What sampling distribution will you use? What assumptions are you making?
O The standard normal, since we assume that x has a normal distribution with unknown a.
O The Student's t, since we assume that x has a normal distribution with unknown a.
O The Student's t, since we assume that x has a normal distribution with known a.
O The standard normal, since we assume that x has a normal distribution with known a.
What is the value of the sample test statistic? (Round your answer to three decimal places.)
(c) Find (or estimate) the P-value.
O P-value > 0.250
O 0.125 < P-value < 0.250
O 0.050 < P-value < 0.125
O 0.025 < P-value < 0.050
O 0.005 < P-value < 0.025
O P-value < 0.005
Expert Solution
This question has been solved!
Explore an expertly crafted, step-by-step solution for a thorough understanding of key concepts.

This is a popular solution!

Trending now
This is a popular solution!

Step by step
Solved in 4 steps with 1 images

Knowledge Booster


Learn more about
Need a deep-dive on the concept behind this application? Look no further. Learn more about this topic, statistics and related others by exploring similar questions and additional content below.Recommended textbooks for you
MATLAB: An Introduction with Applications
Statistics
ISBN:
9781119256830
Author:
Amos Gilat
Publisher:
John Wiley & Sons Inc

Probability and Statistics for Engineering and th…
Statistics
ISBN:
9781305251809
Author:
Jay L. Devore
Publisher:
Cengage Learning

Statistics for The Behavioral Sciences (MindTap C…
Statistics
ISBN:
9781305504912
Author:
Frederick J Gravetter, Larry B. Wallnau
Publisher:
Cengage Learning
MATLAB: An Introduction with Applications
Statistics
ISBN:
9781119256830
Author:
Amos Gilat
Publisher:
John Wiley & Sons Inc
Probability and Statistics for Engineering and th…
Statistics
ISBN:
9781305251809
Author:
Jay L. Devore
Publisher:
Cengage Learning
Statistics for The Behavioral Sciences (MindTap C…
Statistics
ISBN:
9781305504912
Author:
Frederick J Gravetter, Larry B. Wallnau
Publisher:
Cengage Learning

Elementary Statistics: Picturing the World (7th E…
Statistics
ISBN:
9780134683416
Author:
Ron Larson, Betsy Farber
Publisher:
PEARSON

The Basic Practice of Statistics
Statistics
ISBN:
9781319042578
Author:
David S. Moore, William I. Notz, Michael A. Fligner
Publisher:
W. H. Freeman

Introduction to the Practice of Statistics
Statistics
ISBN:
9781319013387
Author:
David S. Moore, George P. McCabe, Bruce A. Craig
Publisher:
W. H. Freeman