The Transportation Security Administration (TSA) collects data on wait time at each of its airport security checkpoints. For flights departing from Terminal 9 at John F. Kennedy International Airport (JFK) between 3:00 and 4:00 PM on Wednesday, the mean wait time is 10 minutes, and the maximum wait time is 18 minutes. [Source: Transportation Security Administration, summary statistics based on historical data collected between January 8, 2008, and February 5, 2008.] Assume that x, the wait time at the Terminal 9 checkpoint at JFK for flights departing between 3:00 and 4:00 PM on Wednesday, is uniformly distributed between 2 and 18 minutes. Use the Distributions tool to help you answer the questions that follow. Standard Normal Mean = 0.0 Standard Deviation = 1.0 -5 AANAA -3 -1 The height of the graph of the probability density function f(x) varies with X as follows (round to four decimal places): Height of the Graph of the Probability Density Function X < 2 23 XS 18 X > 18
The Transportation Security Administration (TSA) collects data on wait time at each of its airport security checkpoints. For flights departing from Terminal 9 at John F. Kennedy International Airport (JFK) between 3:00 and 4:00 PM on Wednesday, the mean wait time is 10 minutes, and the maximum wait time is 18 minutes. [Source: Transportation Security Administration, summary statistics based on historical data collected between January 8, 2008, and February 5, 2008.] Assume that x, the wait time at the Terminal 9 checkpoint at JFK for flights departing between 3:00 and 4:00 PM on Wednesday, is uniformly distributed between 2 and 18 minutes. Use the Distributions tool to help you answer the questions that follow. Standard Normal Mean = 0.0 Standard Deviation = 1.0 -5 AANAA -3 -1 The height of the graph of the probability density function f(x) varies with X as follows (round to four decimal places): Height of the Graph of the Probability Density Function X < 2 23 XS 18 X > 18

Glencoe Algebra 1, Student Edition, 9780079039897, 0079039898, 2018
18th Edition
ISBN:9780079039897
Author:Carter
Publisher:Carter
Chapter10: Statistics
Section10.3: Measures Of Spread
Problem 1GP

Related questions

Concept explainers
Contingency Table
A contingency table can be defined as the visual representation of the relationship between two or more categorical variables that can be evaluated and registered. It is a categorical version of the scatterplot, which is used to investigate the linear relationship between two variables. A contingency table is indeed a type of frequency distribution table that displays two variables at the same time.
Binomial Distribution
Binomial is an algebraic expression of the sum or the difference of two terms. Before knowing about binomial distribution, we must know about the binomial theorem.
Topic Video
Question
8 2
Transcribed Image Text:Height of the Graph of the Probability Density Function
X < 2
23xS 18
X > 18
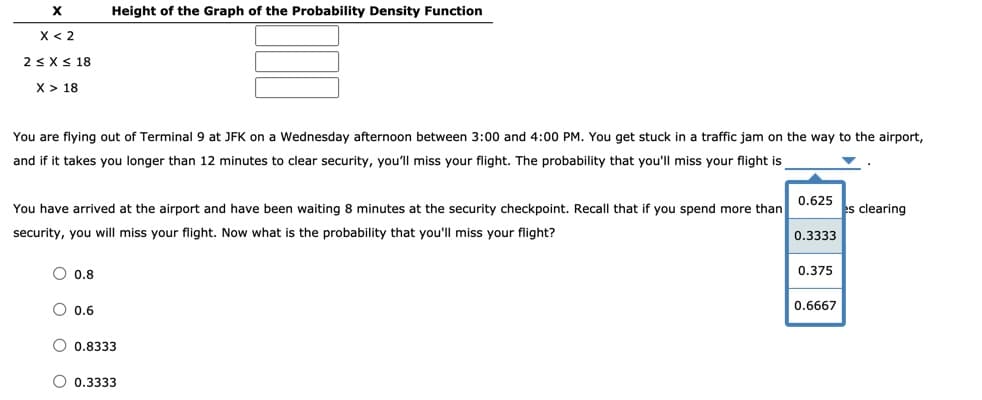
You are flying out of Terminal 9 at JFK on a Wednesday afternoon between 3:00 and 4:00 PM. You get stuck in a traffic jam on the way to the airport,
and if it takes you longer than 12 minutes to clear security, you'll miss your flight. The probability that you'll miss your flight is
0.625
You have arrived at the airport and have been waiting 8 minutes at the security checkpoint. Recall that if you spend more than
es clearing
security, you will miss your flight. Now what is the probability that you'll miss your flight?
0.3333
O 0.8
0.375
O 0.6
0.6667
O 0.8333
O 0.3333
![The Transportation Security Administration (TSA) collects data on wait time at each of its airport security checkpoints. For flights departing from
Terminal 9 at John F. Kennedy International Airport (JFK) between 3:00 and 4:00 PM on Wednesday, the mean wait time is 10 minutes, and the
maximum wait time is 18 minutes. [Source: Transportation Security Administration, summary statistics based on historical data collected between
January 8, 2008, and February 5, 2008.]
Assume that x, the wait time at the Terminal 9 checkpoint at JFK for flights departing between 3:00 and 4:00 PM on Wednesday, is uniformly
distributed between 2 and 18 minutes.
Use the Distributions tool to help you answer the questions that follow.
Standard Normal
Mean = 0.0
Standard Deviation = 1.0
-3
The height of the graph of the probability density function f(x) varies with X as follows (round to four decimal places):
Height of the Graph of the Probability Density Function
X < 2
23 XS 18
X > 18](/v2/_next/image?url=https%3A%2F%2Fcontent.bartleby.com%2Fqna-images%2Fquestion%2Feec98ffb-2ae1-4e4b-9ab5-83bd1e7887bf%2Fba977270-4d6a-4b11-8df1-8cfa311838c5%2F1r0a8qm_processed.jpeg&w=3840&q=75)
Transcribed Image Text:The Transportation Security Administration (TSA) collects data on wait time at each of its airport security checkpoints. For flights departing from
Terminal 9 at John F. Kennedy International Airport (JFK) between 3:00 and 4:00 PM on Wednesday, the mean wait time is 10 minutes, and the
maximum wait time is 18 minutes. [Source: Transportation Security Administration, summary statistics based on historical data collected between
January 8, 2008, and February 5, 2008.]
Assume that x, the wait time at the Terminal 9 checkpoint at JFK for flights departing between 3:00 and 4:00 PM on Wednesday, is uniformly
distributed between 2 and 18 minutes.
Use the Distributions tool to help you answer the questions that follow.
Standard Normal
Mean = 0.0
Standard Deviation = 1.0
-3
The height of the graph of the probability density function f(x) varies with X as follows (round to four decimal places):
Height of the Graph of the Probability Density Function
X < 2
23 XS 18
X > 18
Expert Solution
This question has been solved!
Explore an expertly crafted, step-by-step solution for a thorough understanding of key concepts.

This is a popular solution!

Trending now
This is a popular solution!

Step by step
Solved in 3 steps

Knowledge Booster


Learn more about
Need a deep-dive on the concept behind this application? Look no further. Learn more about this topic, statistics and related others by exploring similar questions and additional content below.Recommended textbooks for you
Glencoe Algebra 1, Student Edition, 9780079039897…
Algebra
ISBN:
9780079039897
Author:
Carter
Publisher:
McGraw Hill

College Algebra (MindTap Course List)
Algebra
ISBN:
9781305652231
Author:
R. David Gustafson, Jeff Hughes
Publisher:
Cengage Learning

Glencoe Algebra 1, Student Edition, 9780079039897…
Algebra
ISBN:
9780079039897
Author:
Carter
Publisher:
McGraw Hill
College Algebra (MindTap Course List)
Algebra
ISBN:
9781305652231
Author:
R. David Gustafson, Jeff Hughes
Publisher:
Cengage Learning