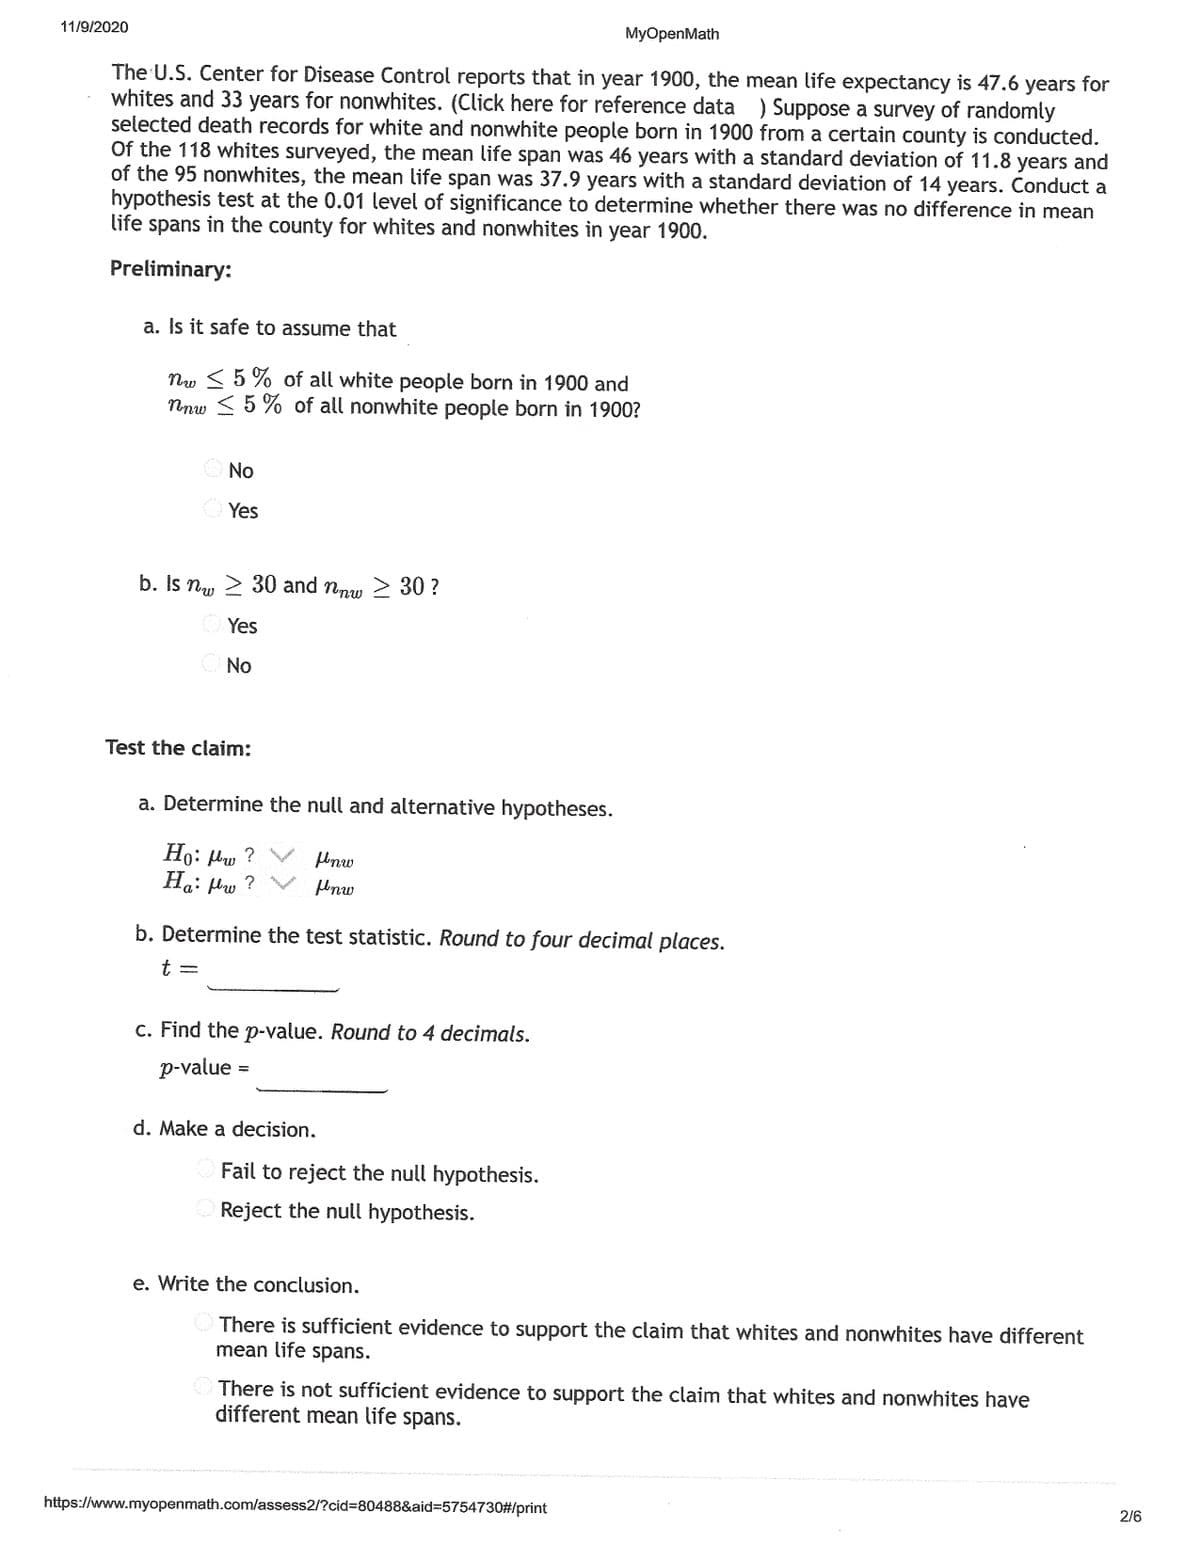
The U.S. Center for Disease Control reports that in year 1900, the mean life expectancy is 47.6 years for whites and 33 years for nonwhites. (Click here for reference data ) Suppose a survey of randomly selected death records for white and nonwhite people born in 1900 from a certain county is conducted. Of the 118 whites surveyed, the mean life span was 46 years with a standard deviation of 11.8 years and of the 95 nonwhites, the mean life span was 37.9 years with a standard deviation of 14 years. Conduct a hypothesis test at the 0.01 level of significance to determine whether there was no difference in mean life spans in the county for whites and nonwhites in year 1900.


Inverse Normal Distribution
The method used for finding the corresponding z-critical value in a normal distribution using the known probability is said to be an inverse normal distribution. The inverse normal distribution is a continuous probability distribution with a family of two parameters.
Mean, Median, Mode
It is a descriptive summary of a data set. It can be defined by using some of the measures. The central tendencies do not provide information regarding individual data from the dataset. However, they give a summary of the data set. The central tendency or measure of central tendency is a central or typical value for a probability distribution.
Z-Scores
A z-score is a unit of measurement used in statistics to describe the position of a raw score in terms of its distance from the mean, measured with reference to standard deviation from the mean. Z-scores are useful in statistics because they allow comparison between two scores that belong to different normal distributions.


Trending now
This is a popular solution!

Step by step
Solved in 2 steps


