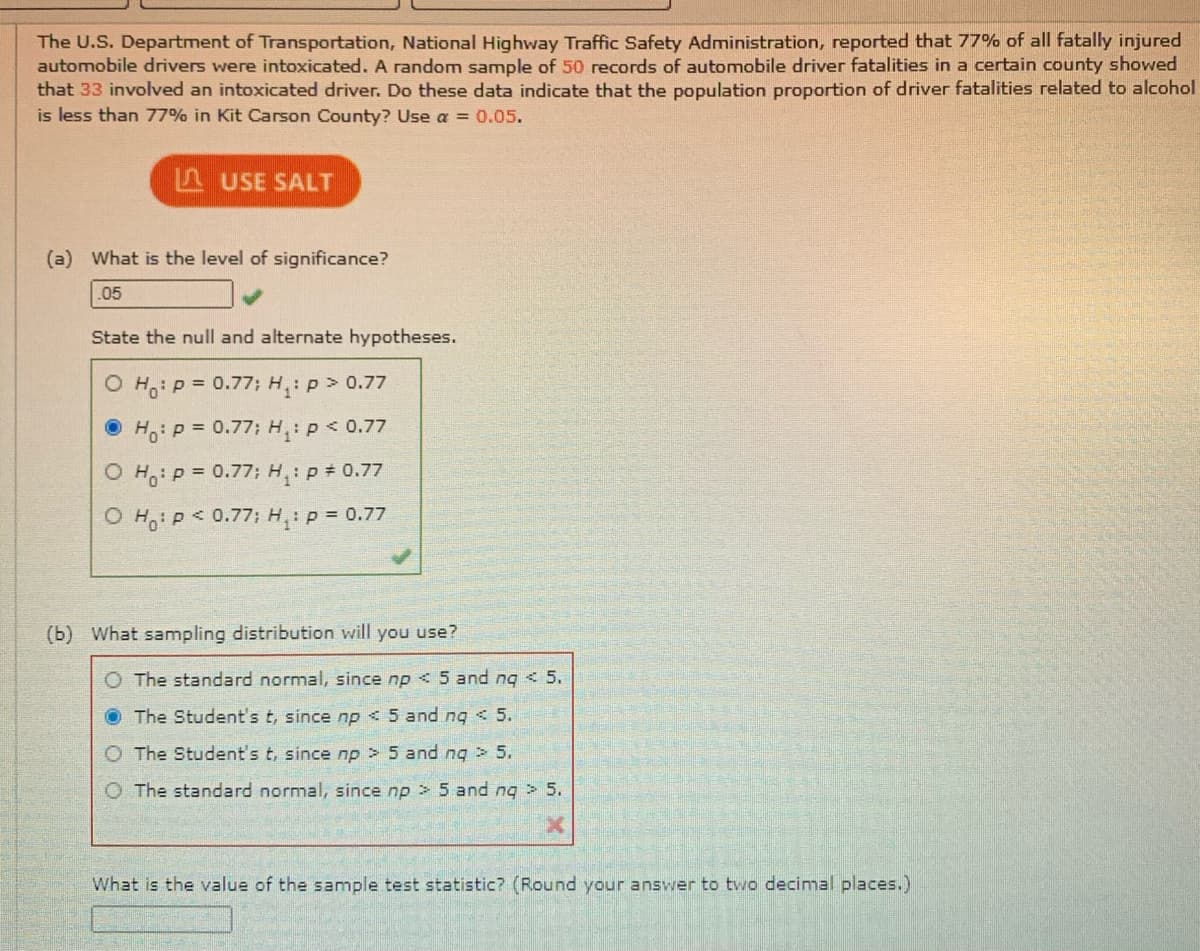
The U.S. Department of Transportation, National Highway Traffic Safety Administration, reported that 77% of all fatally injured automobile drivers were intoxicated. A random sample of 50 records of automobile driver fatalities in a certain county showed that 33 involved an intoxicated driver. Do these data indicate that the population proportion of driver fatalities related to alcohol is less than 77% in Kit Carson County? Use a = 0.05.


Contingency Table
A contingency table can be defined as the visual representation of the relationship between two or more categorical variables that can be evaluated and registered. It is a categorical version of the scatterplot, which is used to investigate the linear relationship between two variables. A contingency table is indeed a type of frequency distribution table that displays two variables at the same time.
Binomial Distribution
Binomial is an algebraic expression of the sum or the difference of two terms. Before knowing about binomial distribution, we must know about the binomial theorem.
Given Information:
Proportion
Sample size
Out of which records involved an intoxicated driver.
Claim: Population proportion of driver fatalities related to alcohol is less than 77%.
Significance level
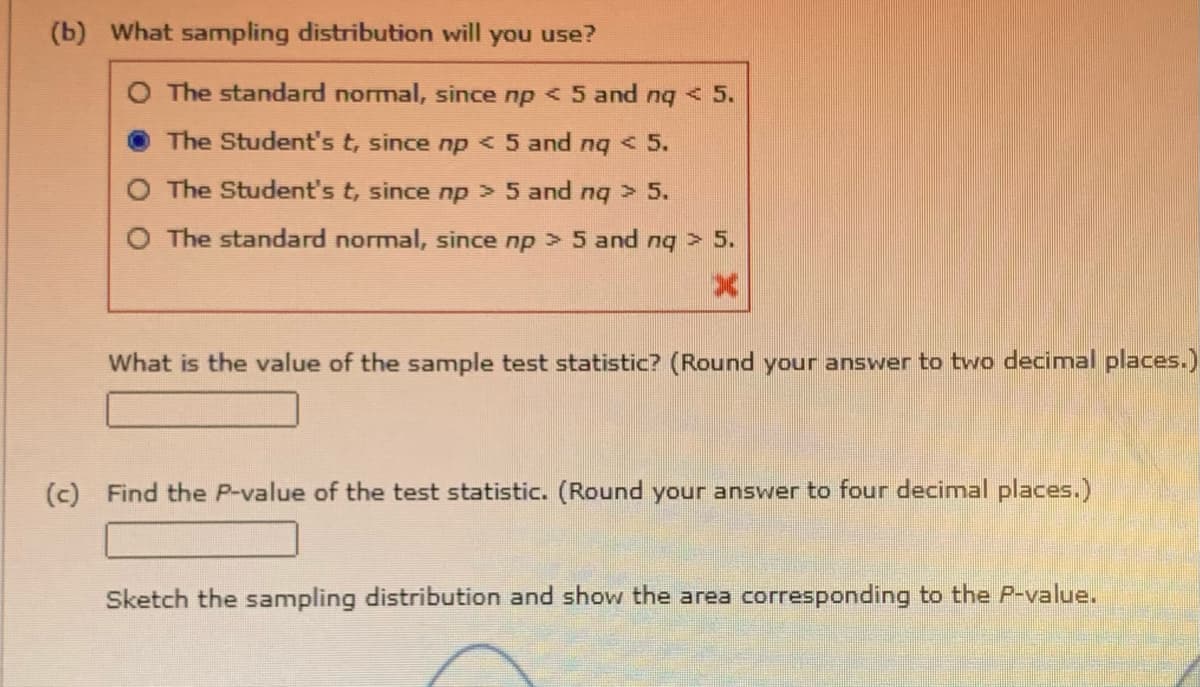
(b) Since, i.e., and i.e.,
We use standard normal distribution.
Sample proportion is the number of successes divided by the sample size. It is given by the formula
So, sample proportion is:

Trending now
This is a popular solution!

Step by step
Solved in 2 steps with 1 images


