A researcher is studying changes in the student body at her university and has selected a random sample of 163 from the freshman class. The table below compares their characteristics to the student body as a whole. Which differences are significant?
A researcher is studying changes in the student body at her university and has selected a random sample of 163 from the freshman class. The table below compares their characteristics to the student body as a whole. Which differences are significant?

Elementary Geometry For College Students, 7e
7th Edition
ISBN:9781337614085
Author:Alexander, Daniel C.; Koeberlein, Geralyn M.
Publisher:Alexander, Daniel C.; Koeberlein, Geralyn M.
Chapter9: Surfaces And Solids
Section9.1: Prisms, Area And Volume
Problem 27E: The box with dimensions indicated is to be constructed of materials that cost 1 cent per square inch...

Related questions
Topic Video
Question
A researcher is studying changes in the student body at her university and has selected a random sample of 163 from the freshman class. The table below compares their characteristics to the student body as a whole. Which differences are significant?
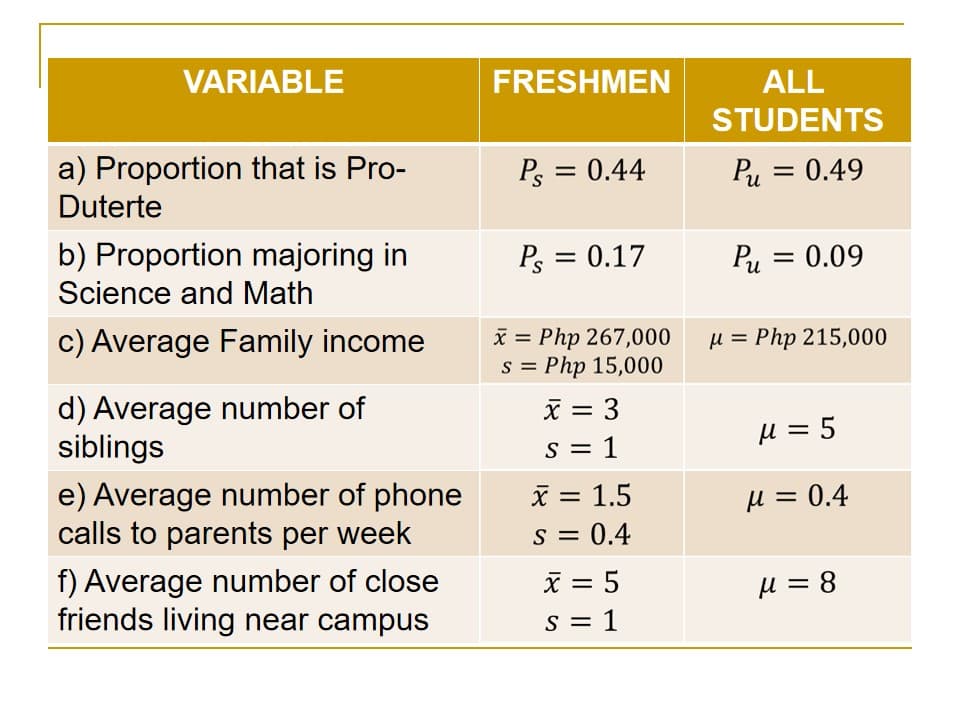
Transcribed Image Text:VARIABLE
FRESHMEN
ALL
STUDENTS
a) Proportion that is Pro-
Ps = 0.44
Pu = 0.49
%3D
Duterte
b) Proportion majoring in
Ps = 0.17
Pu = 0.09
%3D
Science and Math
c) Average Family income
x = Php 267,000
s = Php 15,000
u = Php 215,000
d) Average number of
siblings
x = 3
µ = 5
S = 1
e) Average number of phone
calls to parents per week
X = 1.5
H = 0.4
S = 0.4
f) Average number of close
friends living near campus
x = 5
µ = 8
S = 1
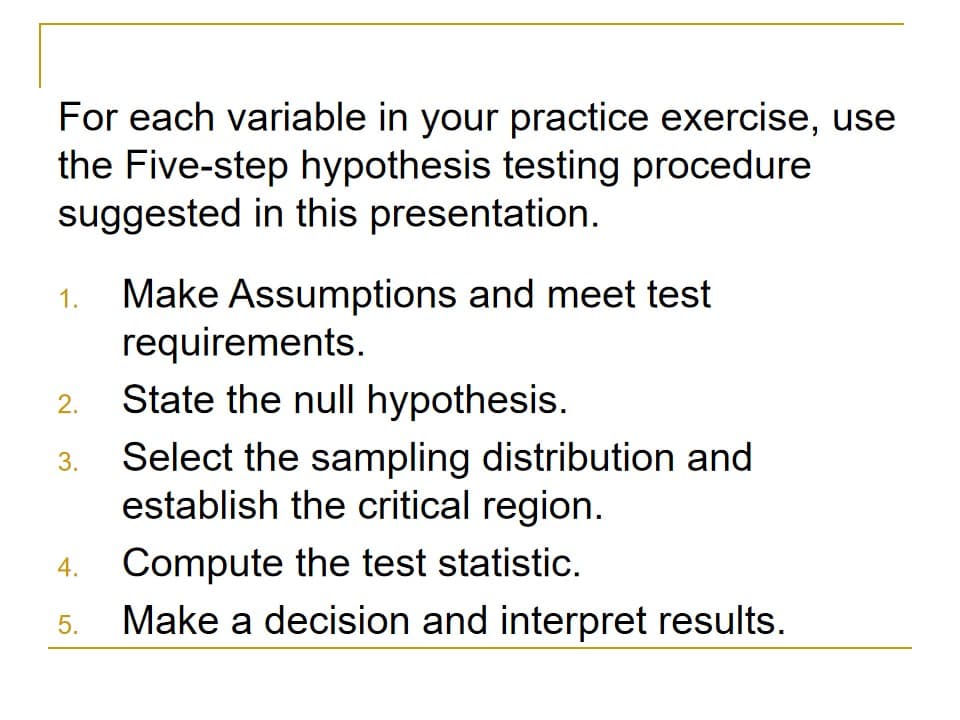
Transcribed Image Text:For each variable in your practice exercise, use
the Five-step hypothesis testing procedure
suggested in this presentation.
Make Assumptions and meet test
requirements.
State the null hypothesis.
1.
2.
Select the sampling distribution and
establish the critical region.
3.
Compute the test statistic.
Make a decision and interpret results.
4.
5.
Expert Solution
This question has been solved!
Explore an expertly crafted, step-by-step solution for a thorough understanding of key concepts.

Step by step
Solved in 2 steps with 9 images

Knowledge Booster


Learn more about
Need a deep-dive on the concept behind this application? Look no further. Learn more about this topic, statistics and related others by exploring similar questions and additional content below.Recommended textbooks for you
Elementary Geometry For College Students, 7e
Geometry
ISBN:
9781337614085
Author:
Alexander, Daniel C.; Koeberlein, Geralyn M.
Publisher:
Cengage,

Algebra & Trigonometry with Analytic Geometry
Algebra
ISBN:
9781133382119
Author:
Swokowski
Publisher:
Cengage

Mathematics For Machine Technology
Advanced Math
ISBN:
9781337798310
Author:
Peterson, John.
Publisher:
Cengage Learning,
Elementary Geometry For College Students, 7e
Geometry
ISBN:
9781337614085
Author:
Alexander, Daniel C.; Koeberlein, Geralyn M.
Publisher:
Cengage,
Algebra & Trigonometry with Analytic Geometry
Algebra
ISBN:
9781133382119
Author:
Swokowski
Publisher:
Cengage
Mathematics For Machine Technology
Advanced Math
ISBN:
9781337798310
Author:
Peterson, John.
Publisher:
Cengage Learning,