There are 50 states in a certain country. The histogram shows murder rates per 100,000 residents and the number of states that had these rates in a certain year. Use this information to complete parts (a) through (e) to the right. Frequency Murder Rates per 100,000 Residents, by State 10- 9- do 00 8- 7- 6. 5-... 730 2- 3 6 10 5 3 3 3 3 3 2 **** 1 14 0+ 0 1 2 3 4 5 6 7 8 9 10 11 12 13 Murder Rate (per 100,000 residents) Rounded to the Nearest Whole Number a. Is the shape of this distribution best classified as normal, skewed left, or skewed right? Choose the correct distribution type below. A. Skewed right B. Normal distribution C. Uniform distribution OD. Skewed left b. Calculate the mean murder rate per 100,000 residents for the states. The mean murder rate is 5.16 murders per 100,000 residents. (Type an integer or decimal rounded to two decimal place as needed) c. Find the median murder rate
There are 50 states in a certain country. The histogram shows murder rates per 100,000 residents and the number of states that had these rates in a certain year. Use this information to complete parts (a) through (e) to the right. Frequency Murder Rates per 100,000 Residents, by State 10- 9- do 00 8- 7- 6. 5-... 730 2- 3 6 10 5 3 3 3 3 3 2 **** 1 14 0+ 0 1 2 3 4 5 6 7 8 9 10 11 12 13 Murder Rate (per 100,000 residents) Rounded to the Nearest Whole Number a. Is the shape of this distribution best classified as normal, skewed left, or skewed right? Choose the correct distribution type below. A. Skewed right B. Normal distribution C. Uniform distribution OD. Skewed left b. Calculate the mean murder rate per 100,000 residents for the states. The mean murder rate is 5.16 murders per 100,000 residents. (Type an integer or decimal rounded to two decimal place as needed) c. Find the median murder rate

Glencoe Algebra 1, Student Edition, 9780079039897, 0079039898, 2018
18th Edition
ISBN:9780079039897
Author:Carter
Publisher:Carter
Chapter10: Statistics
Section: Chapter Questions
Problem 13PT

Related questions
Question
Plz solve this with complete solution or leave it hanging
Transcribed Image Text:The
00
had these
on to
ents,
13
ts)
mber
5
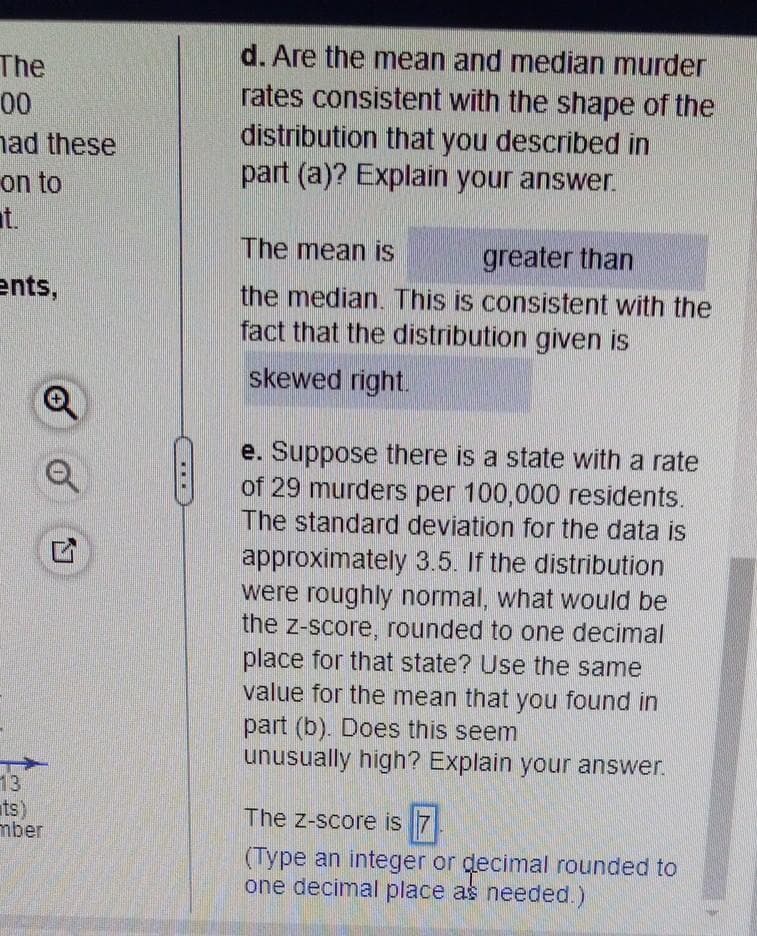
d. Are the mean and median murder
rates consistent with the shape of the
distribution that you described in
part (a)? Explain your answer.
The mean is
greater than
the median. This is consistent with the
fact that the distribution given is
skewed right.
e. Suppose there is a state with a rate
of 29 murders per 100,000 residents.
The standard deviation for the data is
approximately 3.5. If the distribution
were roughly normal, what would be
the z-score, rounded to one decimal
place for that state? Use the same
value for the mean that you found in
part (b). Does this seem
unusually high? Explain your answer.
The Z-score is 7
(Type an integer or decimal rounded to
one decimal place as needed.)
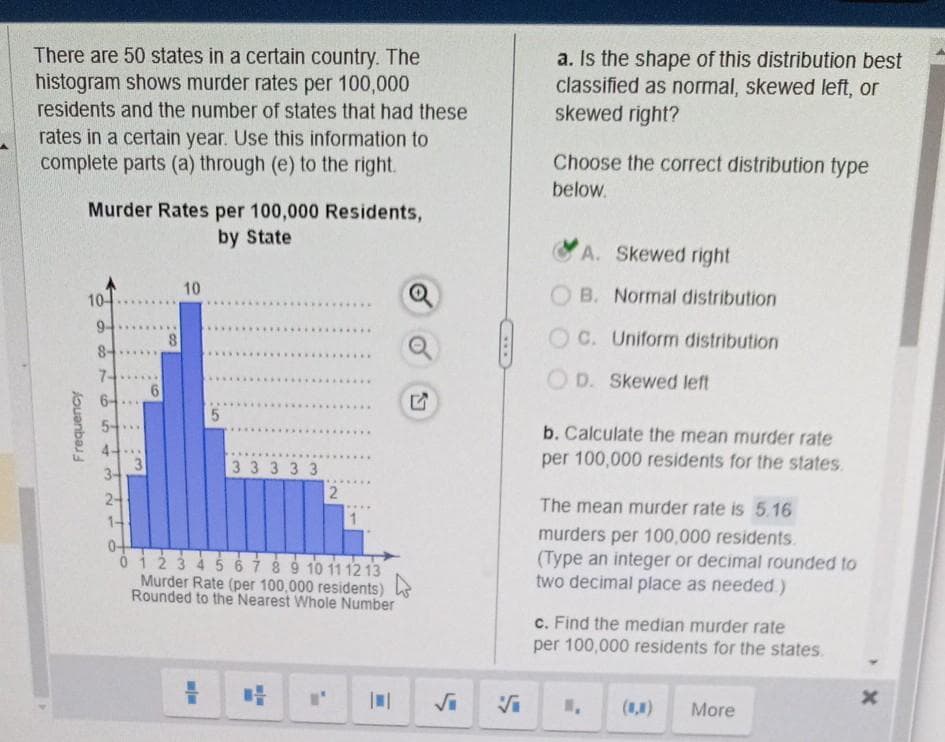
Transcribed Image Text:There are 50 states in a certain country. The
histogram shows murder rates per 100,000
residents and the number of states that had these
rates in a certain year. Use this information to
complete parts (a) through (e) to the right.
Frequency
Murder Rates per 100,000 Residents,
by State
10-
94
84
16
7-
6-
5-
4--
34
24
1-
3
10
5
3 3 3 3 3
L
*****
--
2
04
0 1 2 3 4 5 6 7 8 9 10 11 12 13
Murder Rate (per 100,000 residents)
Rounded to the Nearest Whole Number
****
1
||
Q
a. Is the shape of this distribution best
classified as normal, skewed left, or
skewed right?
Choose the correct distribution type
below.
A. Skewed right
B. Normal distribution
C. Uniform distribution
OD. Skewed left
b. Calculate the mean murder rate
per 100,000 residents for the states.
The mean murder rate is 5.16
murders per 100,000 residents.
(Type an integer or decimal rounded to
two decimal place as needed)
c. Find the median murder rate
per 100,000 residents for the states.
(1) More
x
Expert Solution
This question has been solved!
Explore an expertly crafted, step-by-step solution for a thorough understanding of key concepts.

This is a popular solution!

Trending now
This is a popular solution!

Step by step
Solved in 3 steps

Recommended textbooks for you
Glencoe Algebra 1, Student Edition, 9780079039897…
Algebra
ISBN:
9780079039897
Author:
Carter
Publisher:
McGraw Hill
Glencoe Algebra 1, Student Edition, 9780079039897…
Algebra
ISBN:
9780079039897
Author:
Carter
Publisher:
McGraw Hill