there are two part for the question, I want the answer for the test statistics and the P- Value please! write the answer step by step if possible. I need asap plz
there are two part for the question, I want the answer for the test statistics and the P- Value please! write the answer step by step if possible. I need asap plz

College Algebra (MindTap Course List)
12th Edition
ISBN:9781305652231
Author:R. David Gustafson, Jeff Hughes
Publisher:R. David Gustafson, Jeff Hughes
Chapter8: Sequences, Series, And Probability
Section8.7: Probability
Problem 58E: What is meant by the sample space of an experiment?

Related questions
Question
100%
there are two part for the question, I want the answer for the test statistics and the P- Value please! write the answer step by step if possible.
I need asap plz
Transcribed Image Text:K
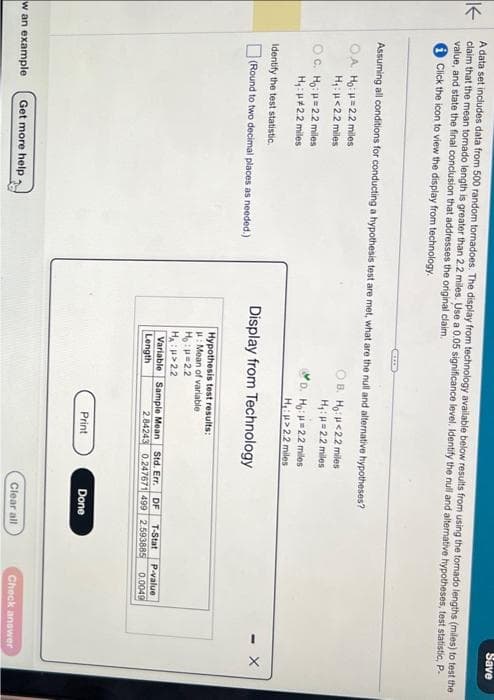
A data set includes data from 500 random tornadoes. The display from technology available below results from using the tomado lengths (miles) to test the
claim that the mean tomado length is greater than 2.2 miles. Use a 0.05 significance level. Identify the null and alternative hypotheses, test statistic, P-
value, and state the final conclusion that addresses the original claim.
Click the icon to view the display from technology.
Assuming all conditions for conducting a hypothesis test are met, what are the null and alternative hypotheses?
OA Ho: H=2.2 miles
OB. Ho: <2.2 miles
H₁: μ<2.2 miles
H₁: H=2.2 miles
OC. Ho: 2.2 miles
H₁: *2.2 miles
Identify the test statistic
(Round to two decimal places as needed.)
w an example Get more help.
D. Ho: H=2.2 miles
Hu>2.2 miles
Display from Technology
Hypothesis test results:
: Mean of variable
но н=22
HA: H>2.2
Variable Sample Mean
Length
2.84243
Print
Std. Err. DF T-Stat
0.247671 499 2.593885
Done
Clear all
P-value
0.0049
I
Save
Check answer
X
Expert Solution
This question has been solved!
Explore an expertly crafted, step-by-step solution for a thorough understanding of key concepts.

Step by step
Solved in 2 steps with 1 images

Recommended textbooks for you
College Algebra (MindTap Course List)
Algebra
ISBN:
9781305652231
Author:
R. David Gustafson, Jeff Hughes
Publisher:
Cengage Learning
College Algebra (MindTap Course List)
Algebra
ISBN:
9781305652231
Author:
R. David Gustafson, Jeff Hughes
Publisher:
Cengage Learning