(b) 20.100 = 1.282 Based on your sample, graph the 95% confidence interval for the population proportion of all winning scratchers. • Enter the values for the lower and upper limits on the graph to show your confidence interval. For the point (+), enter the claim 0.42 from the advertisement. 0.000 0.000 95% confidence interval: 0.500 (c) Does the 95% confidence interval you constructed contradict the claim from the advertisement? Choose the best answer from the choices below. Check Espar 1.000 00 E ΠΡ 1.000 O No, the confidence interval does not contradict the claim. The proportion 0.42 from the advertisement is inside the 95% confidence interval. No, the confidence interval does not contradict the claim. The proportion 0.42 from the advertisement is outside the 95% confidence interval. O Yes, the confidence interval contradicts the claim. The proportion 0.42 from the advertisement is inside the 95% confidence interval. Yes, the confidence interval contradicts the claim. The proportion 0.42 from the advertisement is outside the 95% confidence interval. Q Search IA W X Save For Later G Submit Assignment ©2024 McGraw Hill LLC. All Rights Reserved. Terms of Use | Privacy Center | Accessibility There is a popular lottery in which a ticket is called a scratcher. An advertisement for this lottery claims that 42% of the population of all the scratchers are winning ones. You want to research this claim by selecting a random sample of 48 scratchers. Follow the steps below to construct a 95% confidence interval for the population proportion of all winning scratchers. Then state whether the confidence interval you construct contradicts the advertisement's claim. (If necessary, consult a list of formulas.) (a) Click on Take Sample" to see the results from the random sample. Number Proportion Winning scratcher 10 0.25 Losing scratcher 36 0.75 Enter the values of the sample size, the point estimate of the population proportion, and the critical value you need for your 95% confidence interval. (Choose the correct critical value from the table of critical values provided.) When you are done, select "Compute". Sample size: Point estimate: Critical value: Compute Standard error: Critical values F0.005 2.576 Margin of error: F0.010 =2.326 0.025 = 1.960 95% confidence interval: F0.050 = 1.645 F0.100 = 1.282 (b) Based on your sample, graph the 95% confidence interval for the population proportion of all winning scratchers. Check Q Search IA W Save For Later Submit Assignment ©2024 McGraw Hill LLC. All Rights Reserved. Terms of Use | Privacy Center | Accessibility 00 A ENG
(b) 20.100 = 1.282 Based on your sample, graph the 95% confidence interval for the population proportion of all winning scratchers. • Enter the values for the lower and upper limits on the graph to show your confidence interval. For the point (+), enter the claim 0.42 from the advertisement. 0.000 0.000 95% confidence interval: 0.500 (c) Does the 95% confidence interval you constructed contradict the claim from the advertisement? Choose the best answer from the choices below. Check Espar 1.000 00 E ΠΡ 1.000 O No, the confidence interval does not contradict the claim. The proportion 0.42 from the advertisement is inside the 95% confidence interval. No, the confidence interval does not contradict the claim. The proportion 0.42 from the advertisement is outside the 95% confidence interval. O Yes, the confidence interval contradicts the claim. The proportion 0.42 from the advertisement is inside the 95% confidence interval. Yes, the confidence interval contradicts the claim. The proportion 0.42 from the advertisement is outside the 95% confidence interval. Q Search IA W X Save For Later G Submit Assignment ©2024 McGraw Hill LLC. All Rights Reserved. Terms of Use | Privacy Center | Accessibility There is a popular lottery in which a ticket is called a scratcher. An advertisement for this lottery claims that 42% of the population of all the scratchers are winning ones. You want to research this claim by selecting a random sample of 48 scratchers. Follow the steps below to construct a 95% confidence interval for the population proportion of all winning scratchers. Then state whether the confidence interval you construct contradicts the advertisement's claim. (If necessary, consult a list of formulas.) (a) Click on Take Sample" to see the results from the random sample. Number Proportion Winning scratcher 10 0.25 Losing scratcher 36 0.75 Enter the values of the sample size, the point estimate of the population proportion, and the critical value you need for your 95% confidence interval. (Choose the correct critical value from the table of critical values provided.) When you are done, select "Compute". Sample size: Point estimate: Critical value: Compute Standard error: Critical values F0.005 2.576 Margin of error: F0.010 =2.326 0.025 = 1.960 95% confidence interval: F0.050 = 1.645 F0.100 = 1.282 (b) Based on your sample, graph the 95% confidence interval for the population proportion of all winning scratchers. Check Q Search IA W Save For Later Submit Assignment ©2024 McGraw Hill LLC. All Rights Reserved. Terms of Use | Privacy Center | Accessibility 00 A ENG

Holt Mcdougal Larson Pre-algebra: Student Edition 2012
1st Edition
ISBN:9780547587776
Author:HOLT MCDOUGAL
Publisher:HOLT MCDOUGAL
Chapter11: Data Analysis And Probability
Section11.4: Collecting Data
Problem 2E

Related questions
Question
Transcribed Image Text:(b)
20.100 = 1.282
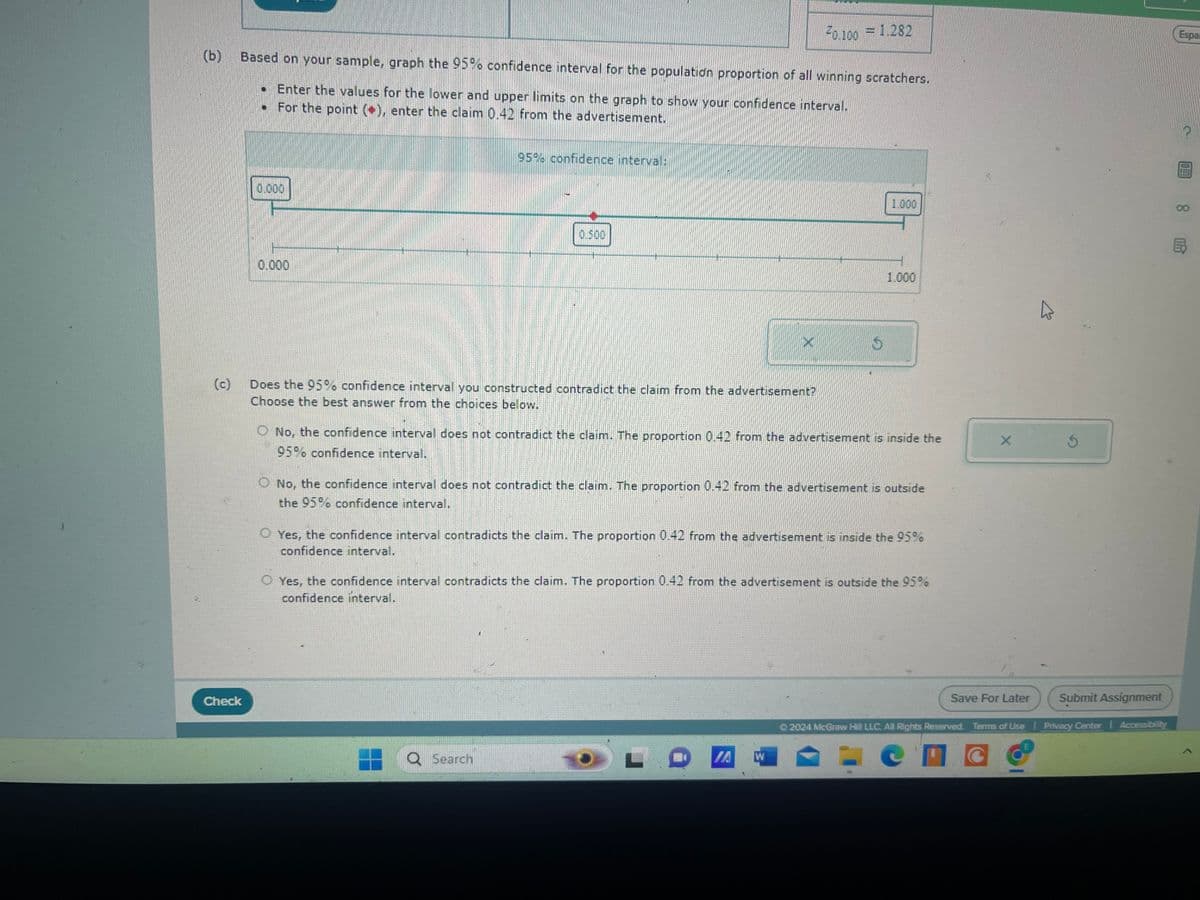
Based on your sample, graph the 95% confidence interval for the population proportion of all winning scratchers.
• Enter the values for the lower and upper limits on the graph to show your confidence interval.
For the point (+), enter the claim 0.42 from the advertisement.
0.000
0.000
95% confidence interval:
0.500
(c)
Does the 95% confidence interval you constructed contradict the claim from the advertisement?
Choose the best answer from the choices below.
Check
Espar
1.000
00
E
ΠΡ
1.000
O No, the confidence interval does not contradict the claim. The proportion 0.42 from the advertisement is inside the
95% confidence interval.
No, the confidence interval does not contradict the claim. The proportion 0.42 from the advertisement is outside
the 95% confidence interval.
O Yes, the confidence interval contradicts the claim. The proportion 0.42 from the advertisement is inside the 95%
confidence interval.
Yes, the confidence interval contradicts the claim. The proportion 0.42 from the advertisement is outside the 95%
confidence interval.
Q Search
IA W
X
Save For Later
G
Submit Assignment
©2024 McGraw Hill LLC. All Rights Reserved. Terms of Use | Privacy Center | Accessibility
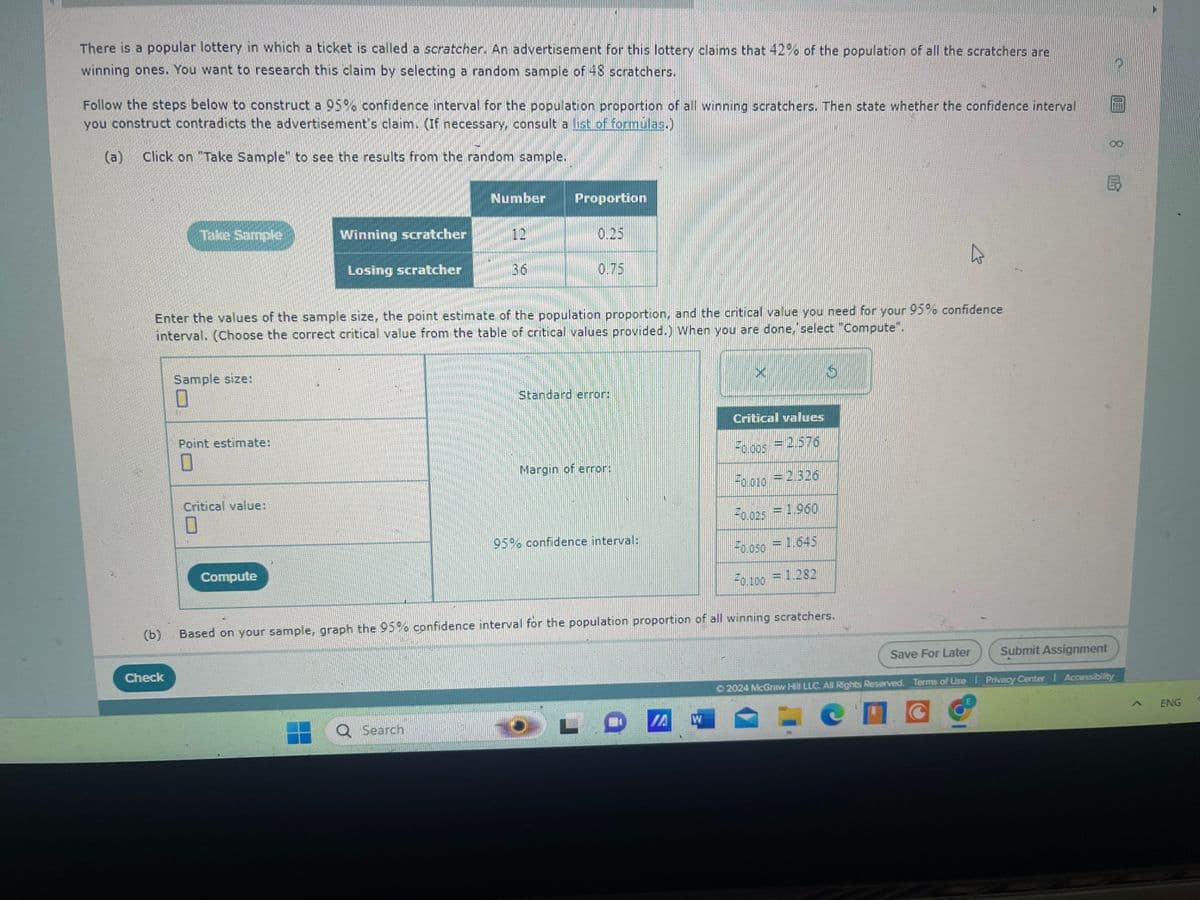
Transcribed Image Text:There is a popular lottery in which a ticket is called a scratcher. An advertisement for this lottery claims that 42% of the population of all the scratchers are
winning ones. You want to research this claim by selecting a random sample of 48 scratchers.
Follow the steps below to construct a 95% confidence interval for the population proportion of all winning scratchers. Then state whether the confidence interval
you construct contradicts the advertisement's claim. (If necessary, consult a list of formulas.)
(a)
Click on Take Sample" to see the results from the random sample.
Number
Proportion
Winning scratcher
10
0.25
Losing scratcher
36
0.75
Enter the values of the sample size, the point estimate of the population proportion, and the critical value you need for your 95% confidence
interval. (Choose the correct critical value from the table of critical values provided.) When you are done, select "Compute".
Sample size:
Point estimate:
Critical value:
Compute
Standard error:
Critical values
F0.005 2.576
Margin of error:
F0.010
=2.326
0.025 = 1.960
95% confidence interval:
F0.050 = 1.645
F0.100 = 1.282
(b)
Based on your sample, graph the 95% confidence interval for the population proportion of all winning scratchers.
Check
Q Search
IA
W
Save For Later
Submit Assignment
©2024 McGraw Hill LLC. All Rights Reserved. Terms of Use | Privacy Center | Accessibility
00
A
ENG
Expert Solution
This question has been solved!
Explore an expertly crafted, step-by-step solution for a thorough understanding of key concepts.

This is a popular solution!

Trending now
This is a popular solution!

Step by step
Solved in 2 steps with 1 images

Recommended textbooks for you
Holt Mcdougal Larson Pre-algebra: Student Edition…
Algebra
ISBN:
9780547587776
Author:
HOLT MCDOUGAL
Publisher:
HOLT MCDOUGAL

College Algebra (MindTap Course List)
Algebra
ISBN:
9781305652231
Author:
R. David Gustafson, Jeff Hughes
Publisher:
Cengage Learning
Holt Mcdougal Larson Pre-algebra: Student Edition…
Algebra
ISBN:
9780547587776
Author:
HOLT MCDOUGAL
Publisher:
HOLT MCDOUGAL
College Algebra (MindTap Course List)
Algebra
ISBN:
9781305652231
Author:
R. David Gustafson, Jeff Hughes
Publisher:
Cengage Learning