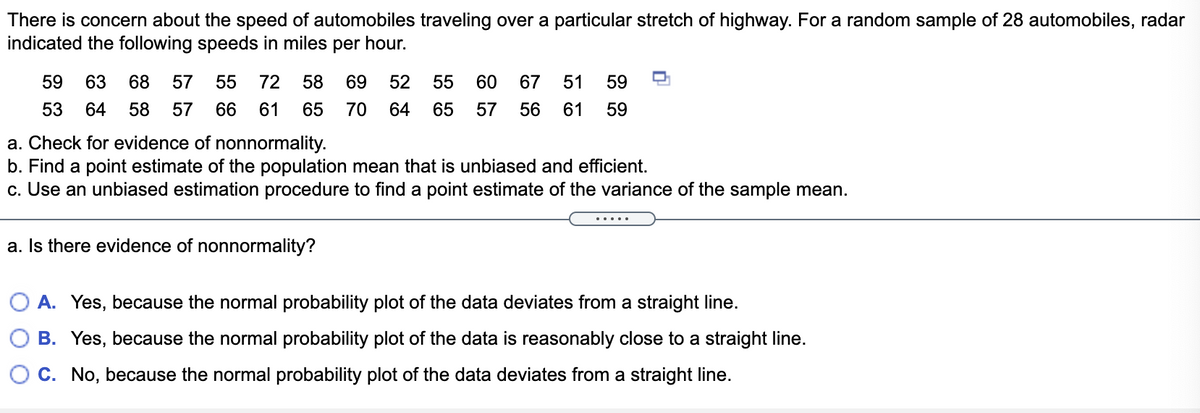
There is concern about the speed of automobiles traveling over a particular stretch of highway. For a random sample of 28 automobiles, radar indicated the following speeds in miles per hour. 59 63 68 57 55 72 58 69 52 55 60 67 51 59 53 64 58 57 66 61 65 70 64 65 57 56 61 59 a. Check for evidence of nonnormality. b. Find a point estimate of the population mean that is unbiased and efficient. c. Use an unbiased estimation procedure to find a point estimate of the variance of the sample mean.
There is concern about the speed of automobiles traveling over a particular stretch of highway. For a random sample of 28 automobiles, radar indicated the following speeds in miles per hour. 59 63 68 57 55 72 58 69 52 55 60 67 51 59 53 64 58 57 66 61 65 70 64 65 57 56 61 59 a. Check for evidence of nonnormality. b. Find a point estimate of the population mean that is unbiased and efficient. c. Use an unbiased estimation procedure to find a point estimate of the variance of the sample mean.

Glencoe Algebra 1, Student Edition, 9780079039897, 0079039898, 2018
18th Edition
ISBN:9780079039897
Author:Carter
Publisher:Carter
Chapter10: Statistics
Section10.4: Distributions Of Data
Problem 19PFA

Related questions
Question
1
Transcribed Image Text:There is concern about the speed of automobiles traveling over a particular stretch of highway. For a random sample of 28 automobiles, radar
indicated the following speeds in miles per hour.
59
63
68
57
55
72
58
69
52
55
60
67
51
59
53
64
58
57
66
61
65
70
64
65
57
56
61
59
a. Check for evidence of nonnormality.
b. Find a point estimate of the population mean that is unbiased and efficient.
c. Use an unbiased estimation procedure to find a point estimate of the variance of the sample mean.
....
a. Is there evidence of nonnormality?
O A. Yes, because the normal probability plot of the data deviates from a straight line.
B. Yes, because the normal probability plot of the data is reasonably close to a straight line.
C. No, because the normal probability plot of the data deviates from a straight line.
Expert Solution
This question has been solved!
Explore an expertly crafted, step-by-step solution for a thorough understanding of key concepts.

This is a popular solution!

Trending now
This is a popular solution!

Step by step
Solved in 3 steps with 3 images

Recommended textbooks for you
Glencoe Algebra 1, Student Edition, 9780079039897…
Algebra
ISBN:
9780079039897
Author:
Carter
Publisher:
McGraw Hill
Glencoe Algebra 1, Student Edition, 9780079039897…
Algebra
ISBN:
9780079039897
Author:
Carter
Publisher:
McGraw Hill