A pollster stands on a street corner in downtown Charlotte and gathers the ages of passers-by. The ages are posted 1. Sample Mean (7) a. 45.32 b. 52.32 e. 55.22 d. 36.12 e. 80.25 Median: a. 45.32 b. 37.00 e. 55.22 d. 36.00 e. 80.25
A pollster stands on a street corner in downtown Charlotte and gathers the ages of passers-by. The ages are posted 1. Sample Mean (7) a. 45.32 b. 52.32 e. 55.22 d. 36.12 e. 80.25 Median: a. 45.32 b. 37.00 e. 55.22 d. 36.00 e. 80.25

Glencoe Algebra 1, Student Edition, 9780079039897, 0079039898, 2018
18th Edition
ISBN:9780079039897
Author:Carter
Publisher:Carter
Chapter10: Statistics
Section10.4: Distributions Of Data
Problem 19PFA

Related questions
Question
please answer all parts of number 1 using the chart attached
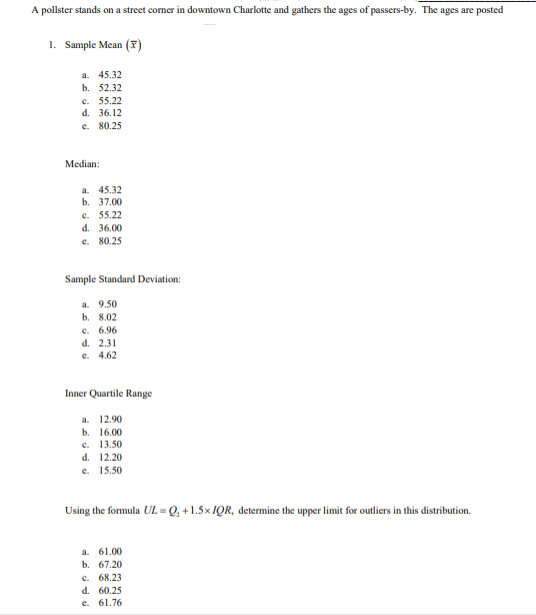
Transcribed Image Text:A pollster stands on a street corner in downtown Charlotte and gathers the ages of passers-by. The ages are posted
1. Sample Mean (F)
a. 45.32
b. 52.32
c. 55.22
d. 36.12
e. 80.25
Median:
a. 45.32
b. 37.00
C. 55.22
d. 36.00
e. 80.25
Sample Standard Deviation:
a. 9.50
b. 8.02
c. 6.96
d. 2.31
e. 4.62
Inner Quartile Range
a. 12.90
b. 16.00
c. 13.50
d. 12.20
e. 15.50
Using the formula UL = Q, +1.5× IQR, determine the upper limit for outliers in this distribution.
a. 61.00
b. 67.20
c. 68.23
d. 60.25
e. 61.76
Transcribed Image Text:A
В
E
G
H
J
K
P
32
52
4
4.81
42
38
2
Ages
44
Grades
54
100
3
20
4.93
Class
48
Class
38
In
38
In
57
Rolls
2
Containers
4.99
1
55
2
40
Charlotte
41
Stats
60
of a
1
Of Gas
4.97
56
40
38
Class
65
Die
4.97
57
42
27
67
4
5.01
61
46
6.
32
68
3
63
54
7
49
71
5
63
54
8
44
73
1
5.01
68
54
9
51
75
4
5
70
55
10
21
77
4.9
70
60
11
12
37
80
6
4.99
72
61
22
82
5
74
62
13
49
83
3
4.99
75
62
14
44
83
4
4.99
76
65
15
43
83
6
4.97
77
67
16
23
91
3
4.97
78
68
17
36
92
80
70
18
42
92
2
4.9
80
72
19
20
34
95
4.99
81
74
22
96
5
81
76
21
36
99
2
84
77
22
43
99
w/
3
88
82
23
49
4
89
85
24
44
6
93
25
06
Sheet1
Expert Solution
This question has been solved!
Explore an expertly crafted, step-by-step solution for a thorough understanding of key concepts.

Step by step
Solved in 2 steps

Knowledge Booster


Learn more about
Need a deep-dive on the concept behind this application? Look no further. Learn more about this topic, statistics and related others by exploring similar questions and additional content below.Recommended textbooks for you
Glencoe Algebra 1, Student Edition, 9780079039897…
Algebra
ISBN:
9780079039897
Author:
Carter
Publisher:
McGraw Hill
Glencoe Algebra 1, Student Edition, 9780079039897…
Algebra
ISBN:
9780079039897
Author:
Carter
Publisher:
McGraw Hill