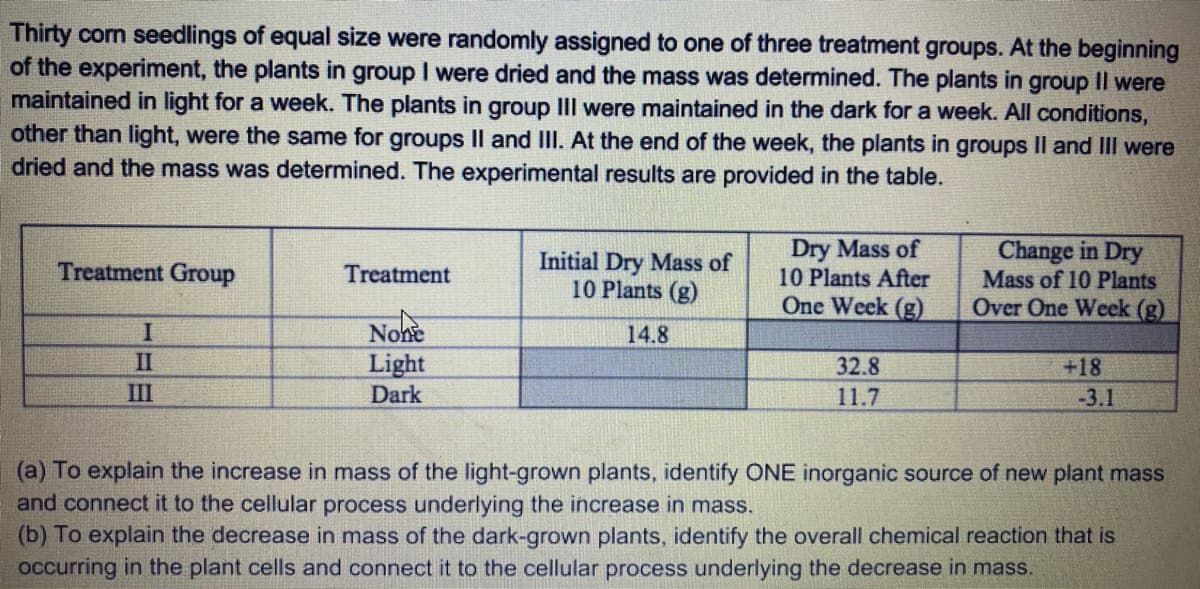
Thirty con seedlings of equal size were randomly assigned to one of three treatment groups. At the beginning of the experiment, the plants in group I were dried and the mass was determined. The plants in group II were maintained in light for a week. The plants in group II were maintained in the dark for a week. All conditions, other than light, were the same for groups Il and IlII. At the end of the week, the plants in groups Il and IIII were dried and the mass was determined. The experimental results are provided in the table.
Thirty con seedlings of equal size were randomly assigned to one of three treatment groups. At the beginning of the experiment, the plants in group I were dried and the mass was determined. The plants in group II were maintained in light for a week. The plants in group II were maintained in the dark for a week. All conditions, other than light, were the same for groups Il and IlII. At the end of the week, the plants in groups Il and IIII were dried and the mass was determined. The experimental results are provided in the table.

Principles Of Radiographic Imaging: An Art And A Science
6th Edition
ISBN:9781337711067
Author:Richard R. Carlton, Arlene M. Adler, Vesna Balac
Publisher:Richard R. Carlton, Arlene M. Adler, Vesna Balac
Chapter15: Beam Restriction
Section: Chapter Questions
Problem 2RQ

Related questions
Question
Transcribed Image Text:Thirty corn seedlings of equal size were randomly assigned to one of three treatment groups. At the beginning
of the experiment, the plants in group I were dried and the mass was determined. The plants in group Il were
maintained in light for a week. The plants in group III were maintained in the dark for a week. All conditions,
other than light, were the same for groups IlI and III. At the end of the week, the plants in groups Il and III were
dried and the mass was determined. The experimental results are provided in the table.
Initial Dry Mass of
10 Plants (g)
Dry Mass of
10 Plants After
One Week (g)
Change in Dry
Mass of 10 Plants
Over One Week (g)
Treatment Group
Treatment
Nohe
14.8
II
Light
32.8
+18
III
Dark
11.7
-3.1
(a) To explain the increase in mass of the light-grown plants, identify ONE inorganic source of new plant mass
and connect it to the cellular process underlying the increase in mass.
(b) To explain the decrease in mass of the dark-grown plants, identify the overall chemical reaction that is
occurring in the plant cells and connect it to the cellular process underlying the decrease in mass.
Expert Solution
This question has been solved!
Explore an expertly crafted, step-by-step solution for a thorough understanding of key concepts.

This is a popular solution!

Trending now
This is a popular solution!

Step by step
Solved in 2 steps

Knowledge Booster


Learn more about
Need a deep-dive on the concept behind this application? Look no further. Learn more about this topic, biology and related others by exploring similar questions and additional content below.Recommended textbooks for you
Principles Of Radiographic Imaging: An Art And A …
Health & Nutrition
ISBN:
9781337711067
Author:
Richard R. Carlton, Arlene M. Adler, Vesna Balac
Publisher:
Cengage Learning
Principles Of Radiographic Imaging: An Art And A …
Health & Nutrition
ISBN:
9781337711067
Author:
Richard R. Carlton, Arlene M. Adler, Vesna Balac
Publisher:
Cengage Learning