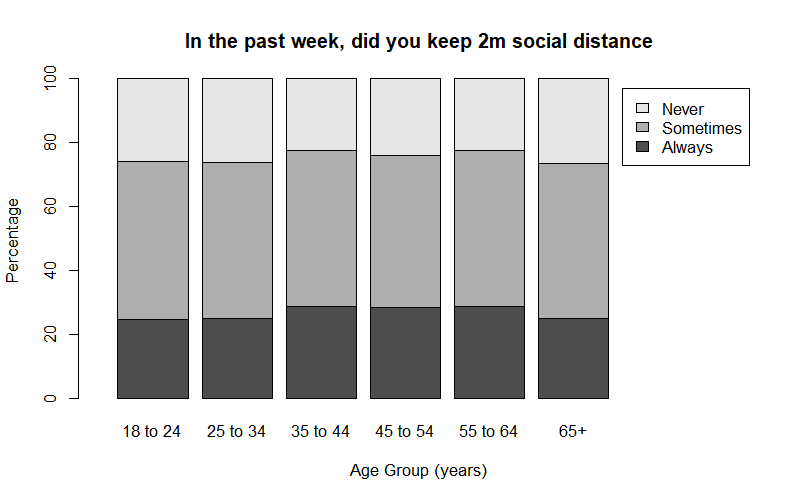
This bargraph attached illustrates the responses of different age groups to the following inquiry: "Over the past week, how often did you maintain the recommended 2-meter COVID social distance rule?" What ONE of the below options can be inferred from the graph? a) The plot reveals that a majority of individuals across all age groups tend to practice 2-meter social distancing at least some of the time. b) It indicates that the likelihood of adhering to 2-meter social distancing tends to increase with age. c)The plot suggests a correlation between age groups and the adherence to 2-meter social distancing. d) Notably, a considerable number of adults aged 55 to 64 do not maintain a 2-meter social distance.
This bargraph attached illustrates the responses of different age groups to the following inquiry: "Over the past week, how often did you maintain the recommended 2-meter COVID social distance rule?" What ONE of the below options can be inferred from the graph? a) The plot reveals that a majority of individuals across all age groups tend to practice 2-meter social distancing at least some of the time. b) It indicates that the likelihood of adhering to 2-meter social distancing tends to increase with age. c)The plot suggests a correlation between age groups and the adherence to 2-meter social distancing. d) Notably, a considerable number of adults aged 55 to 64 do not maintain a 2-meter social distance.

College Algebra (MindTap Course List)
12th Edition
ISBN:9781305652231
Author:R. David Gustafson, Jeff Hughes
Publisher:R. David Gustafson, Jeff Hughes
Chapter8: Sequences, Series, And Probability
Section8.6: Permutations And Combinations
Problem 5SC: In how many ways can 5 people stand in a line if one person demands to be first?

Related questions
Question
This bargraph attached illustrates the responses of different age groups to the following inquiry: "Over the past week, how often did you maintain the recommended 2-meter COVID social distance rule?"
What ONE of the below options can be inferred from the graph?
a) The plot reveals that a majority of individuals across all age groups tend to practice 2-meter social distancing at least some of the time.
b) It indicates that the likelihood of adhering to 2-meter social distancing tends to increase with age.
c)The plot suggests a
d) Notably, a considerable number of adults aged 55 to 64 do not maintain a 2-meter social distance.
Transcribed Image Text:Percentage
100
80
60
40
20
0
18 to 24
In the past week, did you keep 2m social distance
25 to 34 35 to 44
45 to 54 55 to 64
Age Group (years)
65+
Never
Sometimes
Always
Expert Solution
This question has been solved!
Explore an expertly crafted, step-by-step solution for a thorough understanding of key concepts.

Step by step
Solved in 3 steps

Recommended textbooks for you
College Algebra (MindTap Course List)
Algebra
ISBN:
9781305652231
Author:
R. David Gustafson, Jeff Hughes
Publisher:
Cengage Learning

Algebra: Structure And Method, Book 1
Algebra
ISBN:
9780395977224
Author:
Richard G. Brown, Mary P. Dolciani, Robert H. Sorgenfrey, William L. Cole
Publisher:
McDougal Littell

Glencoe Algebra 1, Student Edition, 9780079039897…
Algebra
ISBN:
9780079039897
Author:
Carter
Publisher:
McGraw Hill
College Algebra (MindTap Course List)
Algebra
ISBN:
9781305652231
Author:
R. David Gustafson, Jeff Hughes
Publisher:
Cengage Learning
Algebra: Structure And Method, Book 1
Algebra
ISBN:
9780395977224
Author:
Richard G. Brown, Mary P. Dolciani, Robert H. Sorgenfrey, William L. Cole
Publisher:
McDougal Littell
Glencoe Algebra 1, Student Edition, 9780079039897…
Algebra
ISBN:
9780079039897
Author:
Carter
Publisher:
McGraw Hill
