This is a test. Use the Distributions tool to find the critical score(s) for the level of significance a = 0.01. The critical score(s) (the value(s) for t that separate(s) the tail(s) from the main body of the distribution, forming the critical region) is/are To calculate the test statistic, you first need to calculate the estimated standard error under the assumption that the null hypothesis is true. The estimated standard error is The test statistic is t = Use the tool to evaluate the null hypothesis; using t-tables without exact degrees of freedom may not lead to an answer with enough precision. (Note: You can place the purple line on your t statistic to tell whether it lies within or outside the critical region. It's possible that this line may not rest exactly on the t statistic, but you will be able to tell whether it lies within or outside the critical region.) The t statistic student in the critical region for a two-tailed hypothesis test. Therefore, the null hypothesis is conclude that journaling affects grief. . The graduate The graduate student repeats his study with another random sample of the same size. This time, instead of the treatment being journaling about their emotions, the treatment is attending a support group for widows and widowers. Suppose the results are very similar. After attending a support group for widows and widowers, the mean score was still 0.4 lower, but this time the standard deviation of the difference was 1.2 (vs. the original standard deviation of 1.9). This means has the more consistent treatment effect. for the This difference in the standard deviation also means that a 95% confidence interval of the mean difference would be original study, when the treatment was journaling about their emotions, than the 95% confidence interval of the mean difference for the second study, when the treatment was attending a support group for widows and widowers. Finally, this difference in the standard deviation means that when the graduate student conducts a hypothesis test testing whether the mean difference is zero for the second study, he will be likely to reject the null hypothesis than he was for the hypothesis test you completed previously for the original study.
This is a test. Use the Distributions tool to find the critical score(s) for the level of significance a = 0.01. The critical score(s) (the value(s) for t that separate(s) the tail(s) from the main body of the distribution, forming the critical region) is/are To calculate the test statistic, you first need to calculate the estimated standard error under the assumption that the null hypothesis is true. The estimated standard error is The test statistic is t = Use the tool to evaluate the null hypothesis; using t-tables without exact degrees of freedom may not lead to an answer with enough precision. (Note: You can place the purple line on your t statistic to tell whether it lies within or outside the critical region. It's possible that this line may not rest exactly on the t statistic, but you will be able to tell whether it lies within or outside the critical region.) The t statistic student in the critical region for a two-tailed hypothesis test. Therefore, the null hypothesis is conclude that journaling affects grief. . The graduate The graduate student repeats his study with another random sample of the same size. This time, instead of the treatment being journaling about their emotions, the treatment is attending a support group for widows and widowers. Suppose the results are very similar. After attending a support group for widows and widowers, the mean score was still 0.4 lower, but this time the standard deviation of the difference was 1.2 (vs. the original standard deviation of 1.9). This means has the more consistent treatment effect. for the This difference in the standard deviation also means that a 95% confidence interval of the mean difference would be original study, when the treatment was journaling about their emotions, than the 95% confidence interval of the mean difference for the second study, when the treatment was attending a support group for widows and widowers. Finally, this difference in the standard deviation means that when the graduate student conducts a hypothesis test testing whether the mean difference is zero for the second study, he will be likely to reject the null hypothesis than he was for the hypothesis test you completed previously for the original study.

Glencoe Algebra 1, Student Edition, 9780079039897, 0079039898, 2018
18th Edition
ISBN:9780079039897
Author:Carter
Publisher:Carter
Chapter10: Statistics
Section10.4: Distributions Of Data
Problem 19PFA

Related questions
Question
Answer correctly and read the questions corretly, this is all one quesiton if done correclty and organized I will write a very nice review about you!
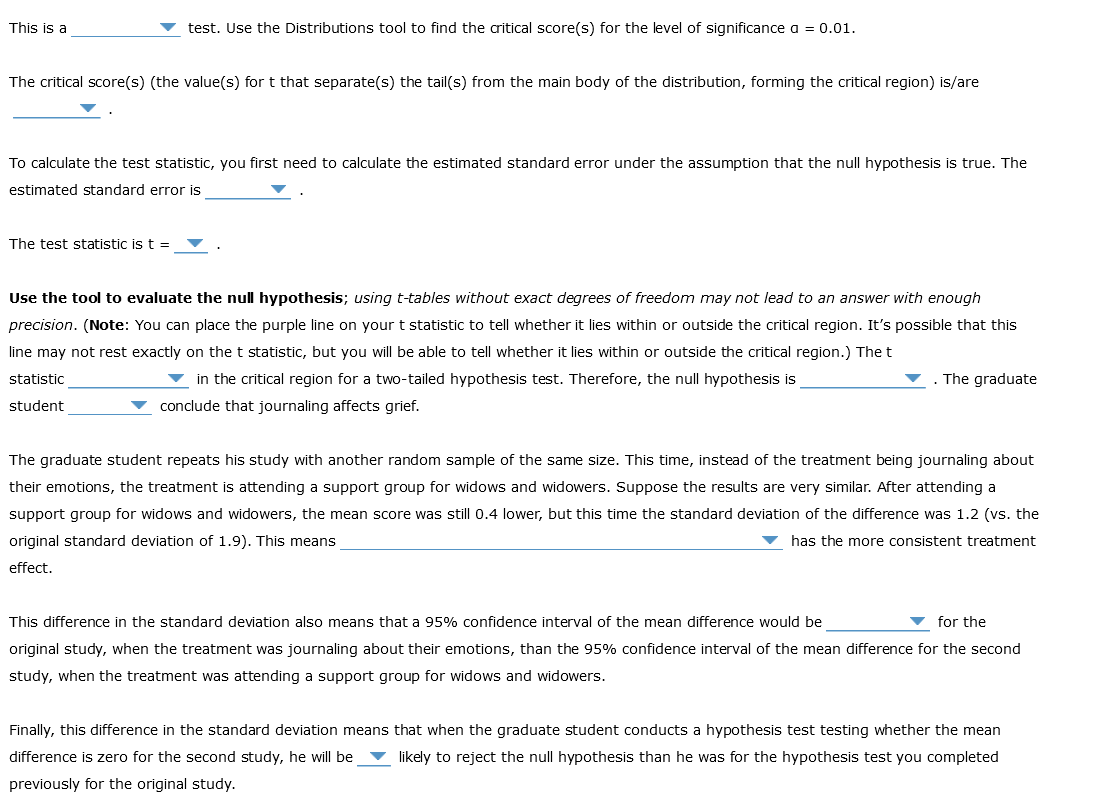
Transcribed Image Text:This is a
test. Use the Distributions tool to find the critical score(s) for the level of significance a = 0.01.
The critical score(s) (the value(s) for t that separate(s) the tail(s) from the main body of the distribution, forming the critical region) is/are
To calculate the test statistic, you first need to calculate the estimated standard error under the assumption that the null hypothesis is true. The
estimated standard error is
The test statistic is t =
Use the tool to evaluate the null hypothesis; using t-tables without exact degrees of freedom may not lead to an answer with enough
precision. (Note: You can place the purple line on your t statistic to tell whether it lies within or outside the critical region. It's possible that this
line may not rest exactly on the t statistic, but you will be able to tell whether it lies within or outside the critical region.) The t
statistic
in the critical region for a two-tailed hypothesis test. Therefore, the null hypothesis is
student
conclude that journaling affects grief.
The graduate
The graduate student repeats his study with another random sample of the same size. This time, instead of the treatment being journaling about
their emotions, the treatment is attending a support group for widows and widowers. Suppose the results are very similar. After attending a
support group for widows and widowers, the mean score was still 0.4 lower, but this time the standard deviation of the difference was 1.2 (vs. the
original standard deviation of 1.9). This means
has the more consistent treatment
effect.
for the
This difference in the standard deviation also means that a 95% confidence interval of the mean difference would be
original study, when the treatment was journaling about their emotions, than the 95% confidence interval of the mean difference for the second
study, when the treatment was attending a support group for widows and widowers.
Finally, this difference in the standard deviation means that when the graduate student conducts a hypothesis test testing whether the mean
difference is zero for the second study, he will be likely to reject the null hypothesis than he was for the hypothesis test you completed
previously for the original study.
Transcribed Image Text:A graduate student is interested in whether journaling can affect grief and healing. For his study, he selects a random sample of 64 adults who
have been widowed within the past 10 to 14 months. The subjects complete a battery of psychological questionnaires before and after spending
two months journaling about their emotions.
Before the two months of journaling, the mean score on the impact of event scale-avoidance subscale, which measures how much individuals
consciously avoid thoughts and feelings associated with the loss of their spouses, was 15.4. After the two months of journaling, the mean score
was 15.0. The mean of the differences between each person's pre- and post- scores was 0.4, with a standard deviation of the differences equal
to 1.9.
The graduate student has no presupposed assumptions about whether journaling can affect grief and healing, so he formulates the null and
alternative hypotheses as:
Ho: PD = 0
H₁: PD = 0
He uses a repeated-measures t test. Because the sample size is large, if the null hypothesis is true as an equality, the test statistic follows a
t-distribution with n - 1 = 64 - 1 = 63 degrees of freedom.
Expert Solution
This question has been solved!
Explore an expertly crafted, step-by-step solution for a thorough understanding of key concepts.

This is a popular solution!

Trending now
This is a popular solution!

Step by step
Solved in 2 steps with 1 images

Recommended textbooks for you
Glencoe Algebra 1, Student Edition, 9780079039897…
Algebra
ISBN:
9780079039897
Author:
Carter
Publisher:
McGraw Hill
Glencoe Algebra 1, Student Edition, 9780079039897…
Algebra
ISBN:
9780079039897
Author:
Carter
Publisher:
McGraw Hill