What is the chi-squared test statistic for this data set?What is the appropriate degrees of freedom value for this test? b.What is the critical value that you would use to determine if there is a difference in the distributions of fish sizes across the different lakes? c.Select a conclusion statement from a list of choices.(photo attached
What is the chi-squared test statistic for this data set?What is the appropriate degrees of freedom value for this test? b.What is the critical value that you would use to determine if there is a difference in the distributions of fish sizes across the different lakes? c.Select a conclusion statement from a list of choices.(photo attached

Algebra & Trigonometry with Analytic Geometry
13th Edition
ISBN:9781133382119
Author:Swokowski
Publisher:Swokowski
Chapter10: Sequences, Series, And Probability
Section10.7: Distinguishable Permutations And Combinations
Problem 15E

Related questions
Question
2w.need help with parts a-c
a.What is the chi-squared test statistic for this data set?What is the appropriate degrees of freedom value for this test?
b.What is the critical value that you would use to determine if there is a difference in the distributions of fish sizes across the different lakes?
c.Select a conclusion statement from a list of choices.(photo attached)
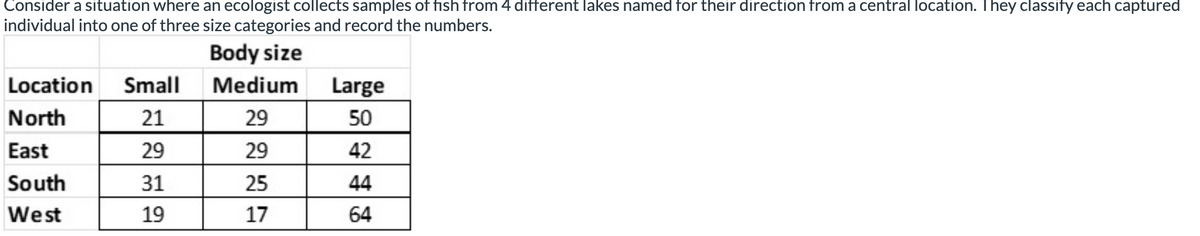
Transcribed Image Text:Consider a situation where an ecologist collects samples of fish from 4 different lakes named for their direction from a central location. They classify each captured
individual into one of three size categories and record the numbers.
Body size
Medium
29
29
25
17
Location Small
North
21
East
29
South
31
West
19
Large
50
42
44
64
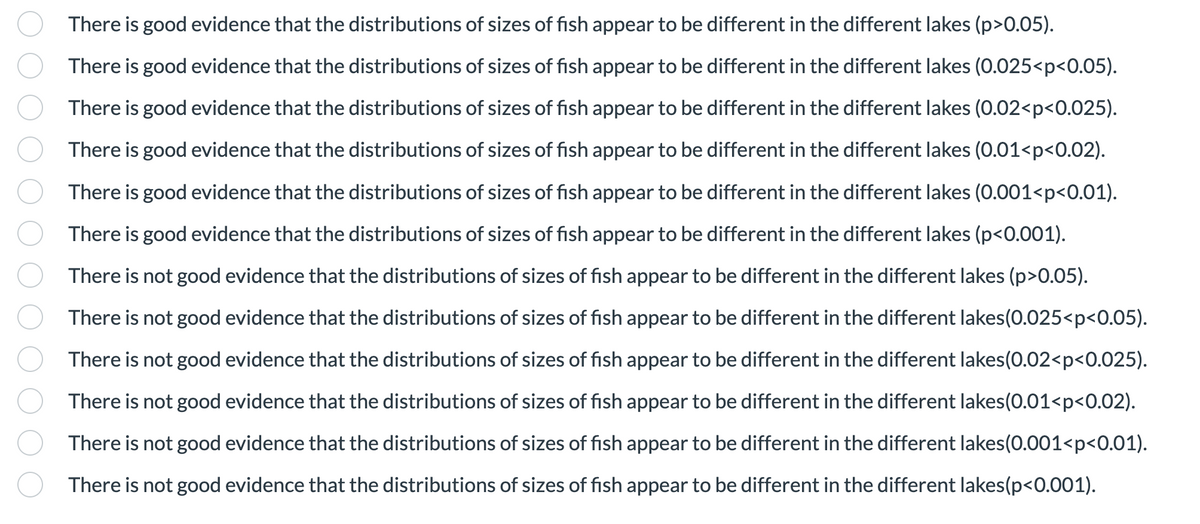
Transcribed Image Text:There is good evidence that the distributions of sizes of fish appear to be different in the different lakes (p>0.05).
There is good evidence that the distributions of sizes of fish appear to be different in the different lakes (0.025<p<0.05).
There is good evidence that the distributions of sizes of fish appear to be different in the different lakes (0.02<p<0.025).
There is good evidence that the distributions of sizes of fish appear to be different in the different lakes (0.01<p<0.02).
There is good evidence that the distributions of sizes of fish appear to be different in the different lakes (0.001<p<0.01).
There is good evidence that the distributions of sizes of fish appear to be different in the different lakes (p<0.001).
There is not good evidence that the distributions of sizes of fish appear to be different in the different lakes (p>0.
There is not good evidence that the distributions of sizes of fish appear to be different in the different lakes(0.025<p<0.05).
There is not good evidence that the distributions of sizes of fish appear to be different in the different lakes(0.02<p<0.025).
There is not good evidence that the distributions of sizes of fish appear to be different in the different lakes(0.01<p<0.02).
There is not good evidence that the distributions of sizes of fish appear to be different in the different lakes (0.001<p<0.01).
There is not good evidence that the distributions of sizes of fish appear to be different in the different lakes(p<0.001).
Expert Solution
This question has been solved!
Explore an expertly crafted, step-by-step solution for a thorough understanding of key concepts.

Step by step
Solved in 6 steps with 3 images

Recommended textbooks for you
Algebra & Trigonometry with Analytic Geometry
Algebra
ISBN:
9781133382119
Author:
Swokowski
Publisher:
Cengage

Glencoe Algebra 1, Student Edition, 9780079039897…
Algebra
ISBN:
9780079039897
Author:
Carter
Publisher:
McGraw Hill

Holt Mcdougal Larson Pre-algebra: Student Edition…
Algebra
ISBN:
9780547587776
Author:
HOLT MCDOUGAL
Publisher:
HOLT MCDOUGAL
Algebra & Trigonometry with Analytic Geometry
Algebra
ISBN:
9781133382119
Author:
Swokowski
Publisher:
Cengage
Glencoe Algebra 1, Student Edition, 9780079039897…
Algebra
ISBN:
9780079039897
Author:
Carter
Publisher:
McGraw Hill
Holt Mcdougal Larson Pre-algebra: Student Edition…
Algebra
ISBN:
9780547587776
Author:
HOLT MCDOUGAL
Publisher:
HOLT MCDOUGAL