This question deals with cost curves Keep in mind that the formula for a firm's cost function is: TC = FC + C(Q) TC → Total Costs: FC →Fixed Costs: C(Q) → Cost of production*Quantity produced → also known as Variable Costs Q1: Firms A and B are two firms supplying products in two separate differentiated goods markets. Equations (1) and (2) give the total cost functions of the two firms: - Firm A: TC = 2Q --- Equation (1) - Firm B: TC = 10 + 2Q --- Equation (2) Each firm has the ability to produce a maximum quantity of 80,000 units in ten batches of 8,000. The cost per unit in each firm is $2. Firm B has a fixed cost of $10. (a) Explain the relationship between the zero-profit curve and the marginal cost curve for the two firms using the quantity schedule of the two firms and the relevant plots of equations (1) and (2).
This question deals with cost curves Keep in mind that the formula for a firm's cost function is: TC = FC + C(Q) TC → Total Costs: FC →Fixed Costs: C(Q) → Cost of production*Quantity produced → also known as Variable Costs Q1: Firms A and B are two firms supplying products in two separate differentiated goods markets. Equations (1) and (2) give the total cost functions of the two firms: - Firm A: TC = 2Q --- Equation (1) - Firm B: TC = 10 + 2Q --- Equation (2) Each firm has the ability to produce a maximum quantity of 80,000 units in ten batches of 8,000. The cost per unit in each firm is $2. Firm B has a fixed cost of $10. (a) Explain the relationship between the zero-profit curve and the marginal cost curve for the two firms using the quantity schedule of the two firms and the relevant plots of equations (1) and (2).

Managerial Economics: Applications, Strategies and Tactics (MindTap Course List)
14th Edition
ISBN:9781305506381
Author:James R. McGuigan, R. Charles Moyer, Frederick H.deB. Harris
Publisher:James R. McGuigan, R. Charles Moyer, Frederick H.deB. Harris
ChapterB: Differential Calculus Techniques In Management
Section: Chapter Questions
Problem 2E

Related questions
Question
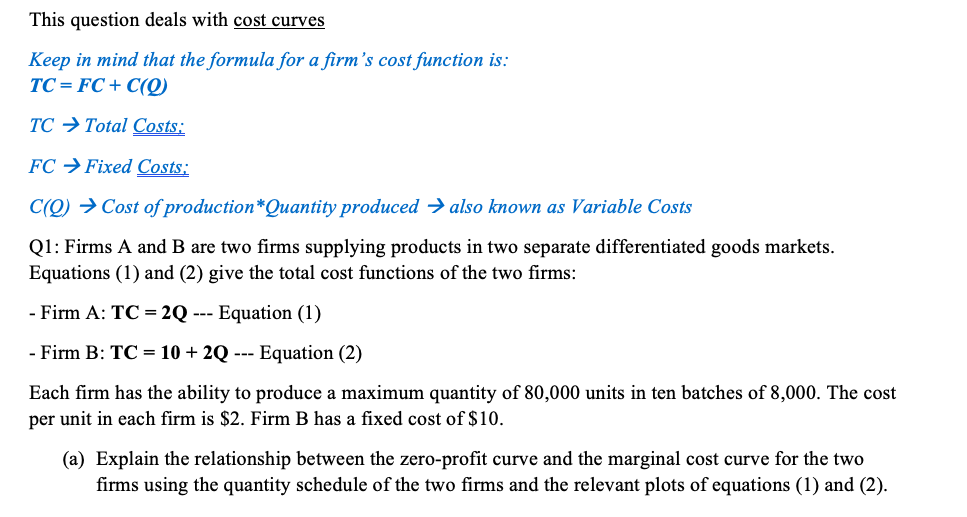
Transcribed Image Text:This question deals with cost curves
Keep in mind that the formula for a firm's cost function is:
TC= FC + C(Q)
TC → Total Costs:
FC →Fixed Costs:
C(Q) → Cost of production*Quantity produced → also known as Variable Costs
Q1: Firms A and B are two firms supplying products in two separate differentiated goods markets.
Equations (1) and (2) give the total cost functions of the two firms:
- Firm A: TC = 2Q --- Equation (1)
- Firm B: TC = 10 + 2Q --- Equation (2)
Each firm has the ability to produce a maximum quantity of 80,000 units in ten batches of 8,000. The cost
per unit in each firm is $2. Firm B has a fixed cost of $10.
(a) Explain the relationship between the zero-profit curve and the marginal cost curve for the two
firms using the quantity schedule of the two firms and the relevant plots of equations (1) and (2).
Expert Solution
This question has been solved!
Explore an expertly crafted, step-by-step solution for a thorough understanding of key concepts.

Step by step
Solved in 5 steps with 2 images

Knowledge Booster


Learn more about
Need a deep-dive on the concept behind this application? Look no further. Learn more about this topic, economics and related others by exploring similar questions and additional content below.Recommended textbooks for you
Managerial Economics: Applications, Strategies an…
Economics
ISBN:
9781305506381
Author:
James R. McGuigan, R. Charles Moyer, Frederick H.deB. Harris
Publisher:
Cengage Learning

Managerial Economics: Applications, Strategies an…
Economics
ISBN:
9781305506381
Author:
James R. McGuigan, R. Charles Moyer, Frederick H.deB. Harris
Publisher:
Cengage Learning