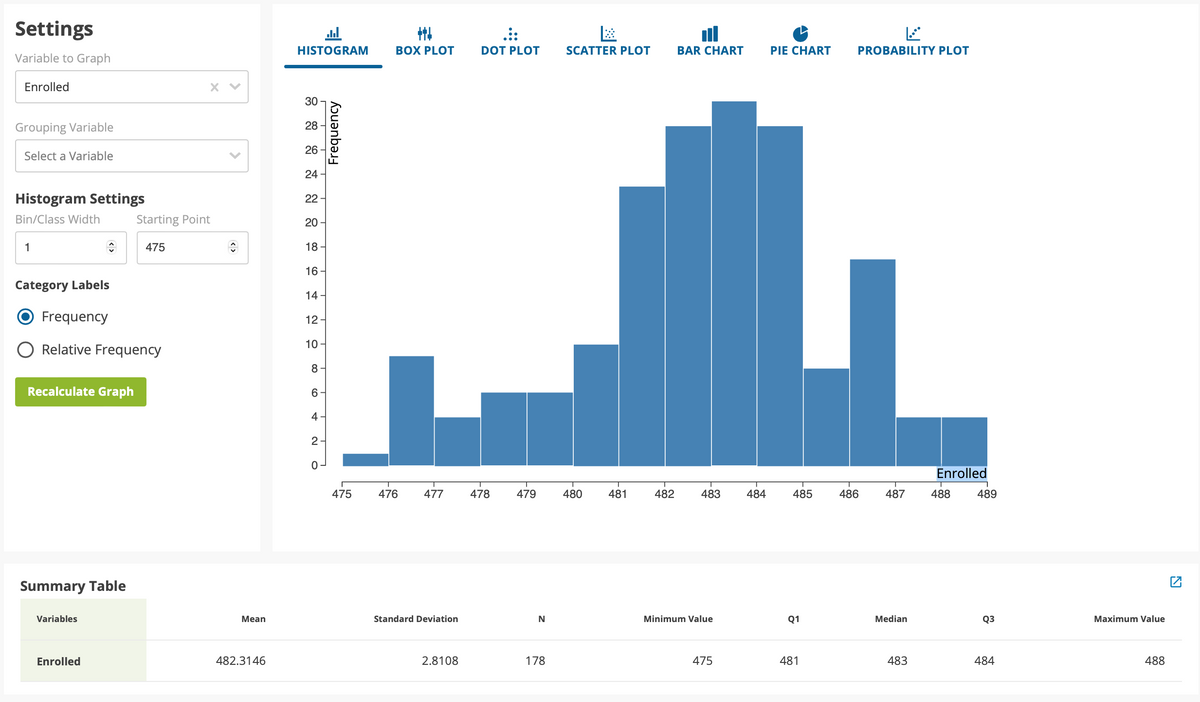
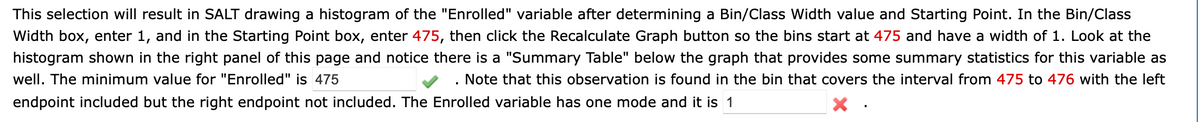
This selection will result in SALT drawing a histogram of the "Enrolled" variable after determining a Bin/Class Width value and Starting Point. In the Bin/Class Width box, enter 1, and in the Starting Point box, enter 475, then click the Recalculate Graph button so the bins start at 475 and have a width of 1. Look at the histogram shown in the right panel of this page and notice there is a "Summary Table" below the graph that provides some summary statistics for this variable as well. The minimum value for "Enrolled" is 475 ✔. Note that this observation is found in the bin that covers the interval from 475 to 476 with the left endpoint included but the right endpoint not included. The Enrolled variable has one mode and it is 1 X
This selection will result in SALT drawing a histogram of the "Enrolled" variable after determining a Bin/Class Width value and Starting Point. In the Bin/Class Width box, enter 1, and in the Starting Point box, enter 475, then click the Recalculate Graph button so the bins start at 475 and have a width of 1. Look at the histogram shown in the right panel of this page and notice there is a "Summary Table" below the graph that provides some summary statistics for this variable as well. The minimum value for "Enrolled" is 475 ✔. Note that this observation is found in the bin that covers the interval from 475 to 476 with the left endpoint included but the right endpoint not included. The Enrolled variable has one mode and it is 1 X

Glencoe Algebra 1, Student Edition, 9780079039897, 0079039898, 2018
18th Edition
ISBN:9780079039897
Author:Carter
Publisher:Carter
Chapter10: Statistics
Section10.5: Comparing Sets Of Data
Problem 5CYU

Related questions
Question
100%
what is
Transcribed Image Text:Settings
Variable to Graph
Enrolled
Grouping Variable
Select a Variable
Histogram Settings
Bin/Class Width
1
Category Labels
Recalculate Graph
Frequency
Relative Frequency
Summary Table
Variables
Enrolled
Starting Point
475
X
>
Mean
482.3146
ul
HISTOGRAM
30
28
26
24
22
20-
18
16
14
12
10
8
6
4
2
9
Frequency
BOX PLOT
475 476
477
Standard Deviation
2.8108
DOT PLOT
478
479
N
178
SCATTER PLOT
T
480 481
ill
BAR CHART
482 483 484
Minimum Value
475
2
PIE CHART
Q1
PROBABILITY PLOT
485 486
481
L
Enrolled
487 488
Median
483
489
Q3
484
Maximum Value
488
Transcribed Image Text:This selection will result in SALT drawing a histogram of the "Enrolled" variable after determining a Bin/Class Width value and Starting Point. In the Bin/Class
Width box, enter 1, and in the Starting Point box, enter 475, then click the Recalculate Graph button so the bins start at 475 and have a width of 1. Look at the
histogram shown in the right panel of this page and notice there is a "Summary Table" below the graph that provides some summary statistics for this variable as
well. The minimum value for "Enrolled" is 475
. Note that this observation is found in the bin that covers the interval from 475 to 476 with the left
endpoint included but the right endpoint not included. The Enrolled variable has one mode and it is 1
Expert Solution
This question has been solved!
Explore an expertly crafted, step-by-step solution for a thorough understanding of key concepts.

This is a popular solution!

Trending now
This is a popular solution!

Step by step
Solved in 3 steps

Recommended textbooks for you
Glencoe Algebra 1, Student Edition, 9780079039897…
Algebra
ISBN:
9780079039897
Author:
Carter
Publisher:
McGraw Hill

Big Ideas Math A Bridge To Success Algebra 1: Stu…
Algebra
ISBN:
9781680331141
Author:
HOUGHTON MIFFLIN HARCOURT
Publisher:
Houghton Mifflin Harcourt

Linear Algebra: A Modern Introduction
Algebra
ISBN:
9781285463247
Author:
David Poole
Publisher:
Cengage Learning
Glencoe Algebra 1, Student Edition, 9780079039897…
Algebra
ISBN:
9780079039897
Author:
Carter
Publisher:
McGraw Hill
Big Ideas Math A Bridge To Success Algebra 1: Stu…
Algebra
ISBN:
9781680331141
Author:
HOUGHTON MIFFLIN HARCOURT
Publisher:
Houghton Mifflin Harcourt
Linear Algebra: A Modern Introduction
Algebra
ISBN:
9781285463247
Author:
David Poole
Publisher:
Cengage Learning