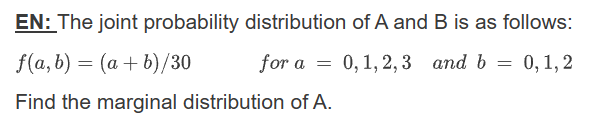
EN: The joint probability distribution of A and B is as follows: f(a, b) = (a + b)/30 Find the marginal distribution of A. for a 0, 1, 2, 3 and b = 0, 1, 2 =


Q: Hamilton County Judges Reporter Kristen DelGuzzi of The Cincinnati Enquirer is writing a piece about…
A: From the provided tree diagram, the following are interpreted: The no of cases that are appealed:…
Q: The number of seconds X after the minute that class ends is uniformly distributed between 0 and 60.…
A: The number of seconds X after the minute that class ends is uniformly distributed between 0 and 60.
Q: Hamilton County Judges Reporter Kristen DelGuzzi of The Cincinnati Enquirer is writing a piece about…
A: The question is about probability Given : Total no. od cases = 182908 No. of reversed cases of…
Q: a) b) Durbin-Watson test is a procedure which is utilised to check whether the errors ('s) on a time…
A: We have given, (a) Durbin-Watson test is a procedure which is utilized to check whether the errors…
Q: An old study reported that 24% of Americans believe in space aliens. A re- searcher wants to…
A: From the provided information,Sample size (n) = 200Sample proportion (p̂) = 0.16Level of…
Q: im trying to produce a relative distribution graph for the number of road accidents and the time of…
A: Since the variable on the x-axis is categorical/qualitative, hour ranges do not matter in the bar…
Q: A university found that 10% of its students withdraw without completing the introductory statistics…
A: Probaibility of students withdraw without completing the introductory statistics…
Q: Babies born with low birth weights (less than 2500 grams) are at an increased risk for many infant…
A: The F test is used to compare the standard deviation of two samples. It is calculated by dividing…
Q: 6 Six wind turbines are to be erected in a straight line across the fields of a farm. The wind…
A: Since you have asked multiple questions, we will solve the first question for you. If you want any…
Q: 68 randomly selected car salespersons were asked the number of cars they generally sell in one week.…
A: No. of people answered that they generally sell 3 cars = 11No. of people answered that they…
Q: What is the probability that a fair six-sided die, rolled 10,000 times, will result in an outcome…
A:
Q: a. Find the quartiles. The first quartile, Q₁, is 56. The second quartile, Q₂, is 58. The third…
A: The data is given from 15 observations. To find the quartiles, IQR, and outliers.
Q: What is the most appropriate hypothesis test for this scenario?
A: We want to test whether the population variance of machine component mass meets the requirement of…
Q: arked the player wins if Te of their spots are ed. Complete the chart =
A:
Q: The correlation in the data image below is ... O positive, but not +1. zero. none of the above.…
A: Relationship between two variables is depicted
Q: The test statistic of z = 2.61 is obtained when testing the claim that p = 0.709. a. Identify the…
A: The question is about hypo. testingGiven :Claim : p ≠ 0.709z test stat = 2.61Level of signif. ( ) =…
Q: An epidemic process is such that an infected individual is infectious for a time period which is…
A: Here, given that the epidemic process is such that an individual is infectious for a time period…
Q: X is a mixture of an exponential distribution with mean 50 and weight 40%, and a single-parameter…
A: with weight is 40% and mean 50 and a single-parameter Pareto dist. with .
Q: Suppose 214 subjects are treated with a drug that is used to treat pain and 54 of them developed…
A: From the provided information,Sample size (n) = 214From which 54 developed nausea.Sample proportion…
Q: Five males with an X-linked genetic disorder have one child each. The random variable x is the…
A: xP(x)00.02910.15220.31930.31940.15250.029
Q: The following data represent the Sales (in $1000) data gathered from a marketing efficacy study in…
A: The provided data is inserted in Excel as follows:
Q: A market researcher would 90 minutes per day with a standard deviation of 15 minutes per day.…
A: Sample size Sample mean Sample standard deviation
Q: Your regression of 49 observations and 3 regressors shows a R = 0.28. What is the value of R²? Enter…
A: Given that,To find the value of R2.
Q: Twelve different video games showing violence were observed. The duration times of violence were…
A: Let be the population mean.Given that,
Q: At I Love Food restaurant, you can choose from 11 appetizers, 12 entrees and 2 desserts. How many…
A: Suppose in the restaurant we can choose from appetizers, entrees and desserts.
Q: Students in a statistics class took their second test. The following are the scores they earned.…
A: The charts are the visual representation of the data set. It is used for easy understanding and…
Q: Assume that the probability of a being born with Genetic Condition B is �=17/30. A study looks at a…
A: To find the most likely number of volunteers out of 286 to have Genetic Condition B, we can multiply…
Q: Check the following hypotheses: 1) Verification of hypothesis variances Ho: o2 = 0; H₁: 02/2 # 03 2)…
A: The standard deviation of the two samples is compared using the F test. It tests the variance of…
Q: A manufacturing machine has a 70% defect rate. If 143 items are chosen at random, answer the…
A: “Since you have posted a question with multiple sub parts, we will provide the solution only to the…
Q: Including an additional regressor in a regression always leads to more accurate estimates of…
A: The question at hand explores the implications of including an additional regressor in a regression…
Q: A poll of 2,188 randomly selected adults showed that 90% of them own cell phones. The technology…
A:
Q: Many studies have been conducted to test the effects of marijuana use on mental abilities. In one…
A: The significance level, The information regarding Light marijuana users and Heavy marijuana users…
Q: The median incomes of males in a random sample of 30 states of the United States, including the…
A: The shape of the raw data can be visualized using the histogram. It is used for continuous data…
Q: Use the accompanying a. Find the quartiles. b. Find the interquartile range. c. Identify any…
A: a)The total number of observations is n = 15.
Q: Give conclusions that can be drawn from the graph. How Other Drivers Irk Us Too cautious 2%…
A: From the given pie chart we can conclude:The lowest percentage corresponds to "Too cautious" i.e.,…
Q: ) A chemical supply company currently has in stock 100 lb of a certain chemical, which it sells to…
A: x1234p(x) 0.3 0.5 0.1 0.1
Q: Use the sample data and confidence level to construct the confidence interval estimate of the…
A: n=1200 x=900 CI=99% α=1-0.99=0.01
Q: The scores on an international business entrance have a mean of 480 and a standard deviation of 90.…
A: The mean of data is given as-The standard deviation of the data is given as-
Q: There are many reasons adults use credit cards. A recent survey found that 66% of adults used credit…
A: 66% of adults use credit cards for convenience.Confidence level is 99% i.e., 0.99.Margin of error is…
Q: What is the correlation between educational attainment and annual income across different age groups…
A:
Q: 4. An instructor has two classes, A and B, in a particular has 20, while class B has 30 students. On…
A: It is given that:For class A:The sample size (i.e., the no. of students), ; The sample standard…
Q: Midterm grades are determined partly by time spent studying and partly by efficiency of studying…
A: We can assume that both studying time and efficiency have positive correlation with mid-term grades…
Q: Use the sample data and confidence level given below to complete parts (a) through (d). A research…
A: n=1064X=559
Q: 2. Given a two-factor factorial experiment and the ANOVA summary table that follows, fill in all the…
A: FB=11, MSB=55
Q: how do you determine part e?
A: Refer to part (a) x0.71.42.12.8Totalf(x)0.250.250.250.251It is 3:00 pm and service technicians…
Q: The table below shows the number of state-registered automatic weapons and the murder rate for…
A: We have given data in the form of table which contains, the number of state-registered automatic…
Q: The normal quantile plot shown to the right represents duration times (in seconds) of eruptions of…
A: The given normal quantile plot represents the duration times of eruptions of a certain geyser from…
Q: simple random sample has been selected. Identify the null and alternative hypotheses, test…
A: Here given ,Sample mean = 5.39 kmSample standard deviation = 4.27 kmSample size =…
Q: 1. Suppose that we have N observations denoted by x = (x₁,...,xN), from an autoregressive (AR) model…
A: In this problem, a set of N observations are given which are denoted by x=(x1,x2,...,xN) and these…
Q: You believe that your morning commute to UCLA is decreasing every week. You record the time of 7…
A: A statement of no effect or no difference that depicts the status quo or the default assumption that…
Please do not give solution in image format thanku

Step by step
Solved in 3 steps with 3 images
