Three different assembly methods have been proposed for a new product. A completely randomized experimental design was chosen to determine which assembl method results in the greatest number of parts produced per hour, and 30 workers were randomly selected and assigned to use one of the proposed methods. The number of units produced by each worker follows. Method A В C 95 94 100 75 100 93 92 94 88 99 56 66 73 77 60 92 91 74 100 85 83 87 72 74 91 89 86 93 82 85 Use these data and test to see whether the mean number of parts produced is the 0.05. same with each method. Use a =
Three different assembly methods have been proposed for a new product. A completely randomized experimental design was chosen to determine which assembl method results in the greatest number of parts produced per hour, and 30 workers were randomly selected and assigned to use one of the proposed methods. The number of units produced by each worker follows. Method A В C 95 94 100 75 100 93 92 94 88 99 56 66 73 77 60 92 91 74 100 85 83 87 72 74 91 89 86 93 82 85 Use these data and test to see whether the mean number of parts produced is the 0.05. same with each method. Use a =

MATLAB: An Introduction with Applications
6th Edition
ISBN:9781119256830
Author:Amos Gilat
Publisher:Amos Gilat
Chapter1: Starting With Matlab
Section: Chapter Questions
Problem 1P

Related questions
Question
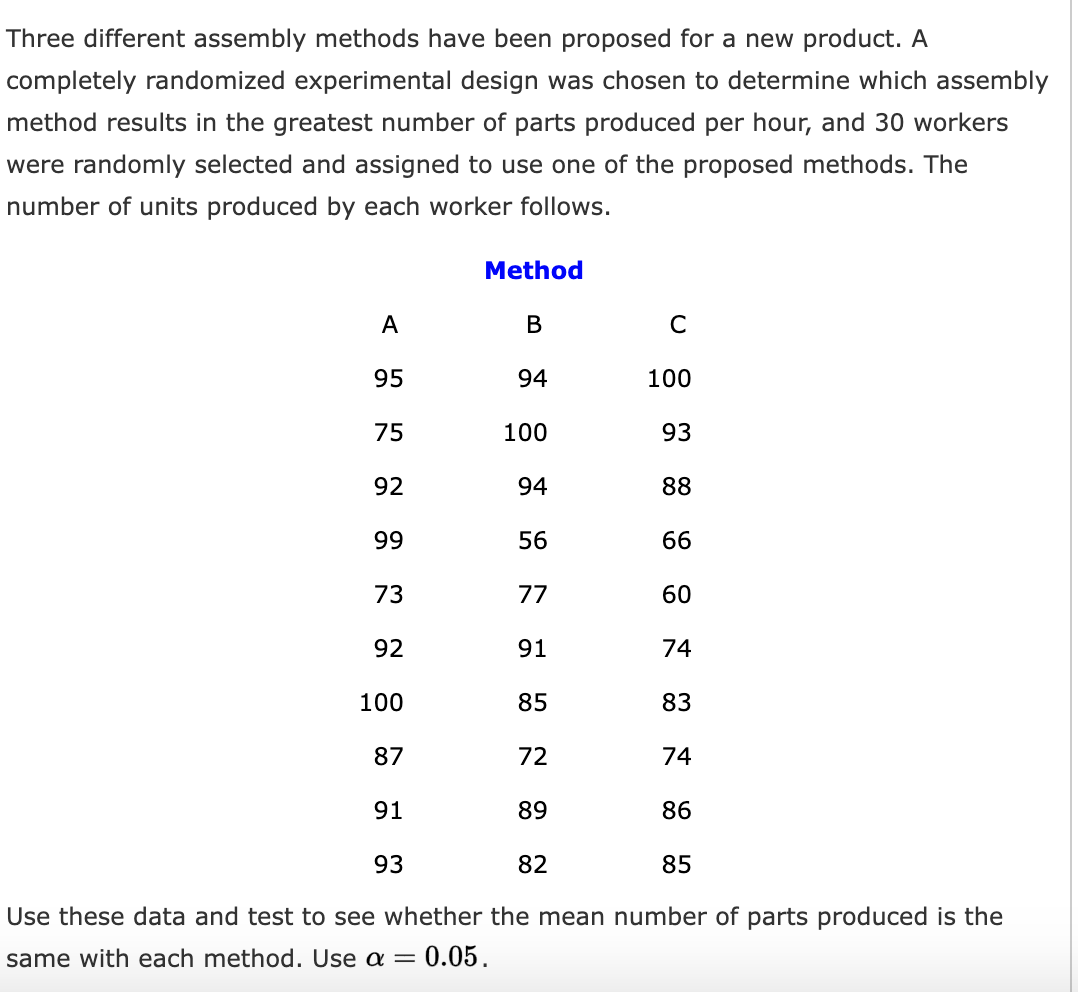
Transcribed Image Text:Three different assembly methods have been proposed for a new product. A
completely randomized experimental design was chosen to determine which assembly
method results in the greatest number of parts produced per hour, and 30 workers
were randomly selected and assigned to use one of the proposed methods. The
number of units produced by each worker follows.
Method
A
В
C
95
94
100
75
100
93
92
94
88
99
56
66
73
77
60
92
91
74
100
85
83
87
72
74
91
89
86
93
82
85
Use these data and test to see whether the mean number of parts produced is the
same with each method. Use a = 0.05.
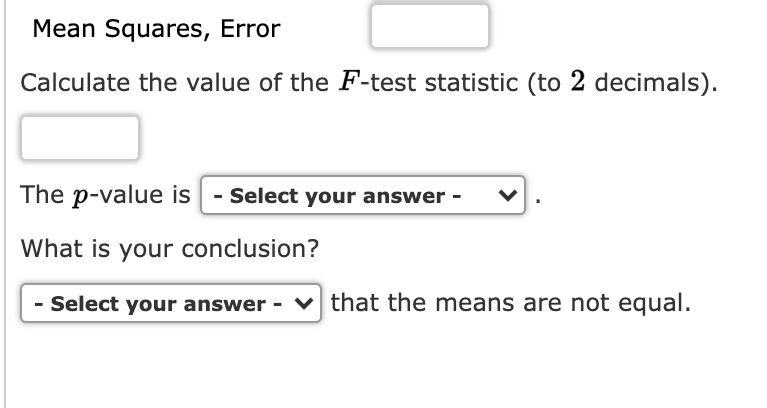
Transcribed Image Text:Mean Squares, Error
Calculate the value of the F-test statistic (to 2 decimals).
The p-value is| - Select your answer -
What is your conclusion?
- Select your answer - v that the means are not equal.
Expert Solution
This question has been solved!
Explore an expertly crafted, step-by-step solution for a thorough understanding of key concepts.

This is a popular solution!

Trending now
This is a popular solution!

Step by step
Solved in 2 steps

Recommended textbooks for you
MATLAB: An Introduction with Applications
Statistics
ISBN:
9781119256830
Author:
Amos Gilat
Publisher:
John Wiley & Sons Inc

Probability and Statistics for Engineering and th…
Statistics
ISBN:
9781305251809
Author:
Jay L. Devore
Publisher:
Cengage Learning

Statistics for The Behavioral Sciences (MindTap C…
Statistics
ISBN:
9781305504912
Author:
Frederick J Gravetter, Larry B. Wallnau
Publisher:
Cengage Learning
MATLAB: An Introduction with Applications
Statistics
ISBN:
9781119256830
Author:
Amos Gilat
Publisher:
John Wiley & Sons Inc
Probability and Statistics for Engineering and th…
Statistics
ISBN:
9781305251809
Author:
Jay L. Devore
Publisher:
Cengage Learning
Statistics for The Behavioral Sciences (MindTap C…
Statistics
ISBN:
9781305504912
Author:
Frederick J Gravetter, Larry B. Wallnau
Publisher:
Cengage Learning

Elementary Statistics: Picturing the World (7th E…
Statistics
ISBN:
9780134683416
Author:
Ron Larson, Betsy Farber
Publisher:
PEARSON

The Basic Practice of Statistics
Statistics
ISBN:
9781319042578
Author:
David S. Moore, William I. Notz, Michael A. Fligner
Publisher:
W. H. Freeman

Introduction to the Practice of Statistics
Statistics
ISBN:
9781319013387
Author:
David S. Moore, George P. McCabe, Bruce A. Craig
Publisher:
W. H. Freeman