Three entrepreneurs were looking to start a new brewpub near Sacramento, California, called Roseville Brewing Company (RBC). Brewpubs provide two products to customers—food from the restaurant segment and freshly brewed beer from the beer production segment. Both segments are typically in the same building, which allows customers to see the beer-brewing process. After months of research, the owners created a financial model that showed the following projections for the first year of operations. Sales Beer sales $ 781,200 Food sales 1,074,150 Other sales 97,650 Total sales $ 1,953,000 Less cost of sales 525,358 Gross margin $ 1,427,642 Less marketing and administrative expenses 1,125,430 Operating profit $ 302,212 In the process of pursuing capital through private investors and financial institutions, RBC was approached with several questions. The following represents a sample of the more common questions asked: What is the break-even point? What sales dollars will be required to make $200,000? To make $500,000? Is the product mix reasonable? (Beer tends to have a higher contribution margin ratio than food, and therefore product mix assumptions are critical to profit projections.) What happens to operating profit if the product mix shifts? How will changes in price affect operating profit? How much does a pint of beer cost to produce? It became clear to the owners of RBC that the initial financial model was not adequate for answering these types of questions. After further research, RBC created another financial model that provided the following information for the first year of operations. Sales Beer sales (40% of total sales) $ 781,200 Food sales (55% of total sales) 1,074,150 Other sales (5% of total sales) 97,650 Total sales $ 1,953,000 Variable Costs Beer (15% of beer sales) $ 117,180 Food (35% of food sales) 375,953 Other (33% of other sales) 32,225 Wages of employees (25% of sales) 488,250 Supplies (1% of sales) 19,530 Utilities (3% of sales) 58,590 Other: credit card, miscellaneous (2% of sales) 39,060 Total variable costs 1,130,788 Contribution margin $ 822,212 Fixed Costs Salaries: manager, chef, brewer $ 140,000 Maintenance 30,000 Advertising 20,000 Other: cleaning, menus, miscellaneous 40,000 Insurance and accounting 40,000 Property taxes 24,000 Depreciation 94,000 Debt service (interest on debt) 132,000 Total fixed costs 520,000 Operating profit $ 302,212 Required: Perform a sensitivity analysis by answering the following questions: What is the break-even point in sales dollars for RBC? What is the margin of safety for RBC? What sales dollars would be required to achieve an operating profit of $200,000? $500,000?


Three entrepreneurs were looking to start a new brewpub near Sacramento, California, called Roseville Brewing Company (RBC). Brewpubs provide two products to customers—food from the restaurant segment and freshly brewed beer from the beer production segment. Both segments are typically in the same building, which allows customers to see the beer-brewing process.
After months of research, the owners created a financial model that showed the following projections for the first year of operations.
| Sales | |
|---|---|
| Beer sales | $ 781,200 |
| Food sales | 1,074,150 |
| Other sales | 97,650 |
| Total sales | $ 1,953,000 |
| Less cost of sales | 525,358 |
| Gross margin | $ 1,427,642 |
| Less marketing and administrative expenses | 1,125,430 |
| Operating profit | $ 302,212 |
In the process of pursuing capital through private investors and financial institutions, RBC was approached with several questions. The following represents a sample of the more common questions asked:
- What is the break-even point?
- What sales dollars will be required to make $200,000? To make $500,000?
- Is the product mix reasonable? (Beer tends to have a higher contribution margin ratio than food, and therefore product mix assumptions are critical to profit projections.)
- What happens to operating profit if the product mix shifts?
- How will changes in price affect operating profit?
- How much does a pint of beer cost to produce?
It became clear to the owners of RBC that the initial financial model was not adequate for answering these types of questions. After further research, RBC created another financial model that provided the following information for the first year of operations.
| Sales | ||
|---|---|---|
| Beer sales (40% of total sales) | $ 781,200 | |
| Food sales (55% of total sales) | 1,074,150 | |
| Other sales (5% of total sales) | 97,650 | |
| Total sales | $ 1,953,000 | |
| Variable Costs | ||
| Beer (15% of beer sales) | $ 117,180 | |
| Food (35% of food sales) | 375,953 | |
| Other (33% of other sales) | 32,225 | |
| Wages of employees (25% of sales) | 488,250 | |
| Supplies (1% of sales) | 19,530 | |
| Utilities (3% of sales) | 58,590 | |
| Other: credit card, miscellaneous (2% of sales) | 39,060 | |
| Total variable costs | 1,130,788 | |
| Contribution margin | $ 822,212 | |
| Fixed Costs | ||
| Salaries: manager, chef, brewer | $ 140,000 | |
| Maintenance | 30,000 | |
| Advertising | 20,000 | |
| Other: cleaning, menus, miscellaneous | 40,000 | |
| Insurance and accounting | 40,000 | |
| Property taxes | 24,000 | |
| 94,000 | ||
| Debt service (interest on debt) | 132,000 | |
| Total fixed costs | 520,000 | |
| Operating profit | $ 302,212 |
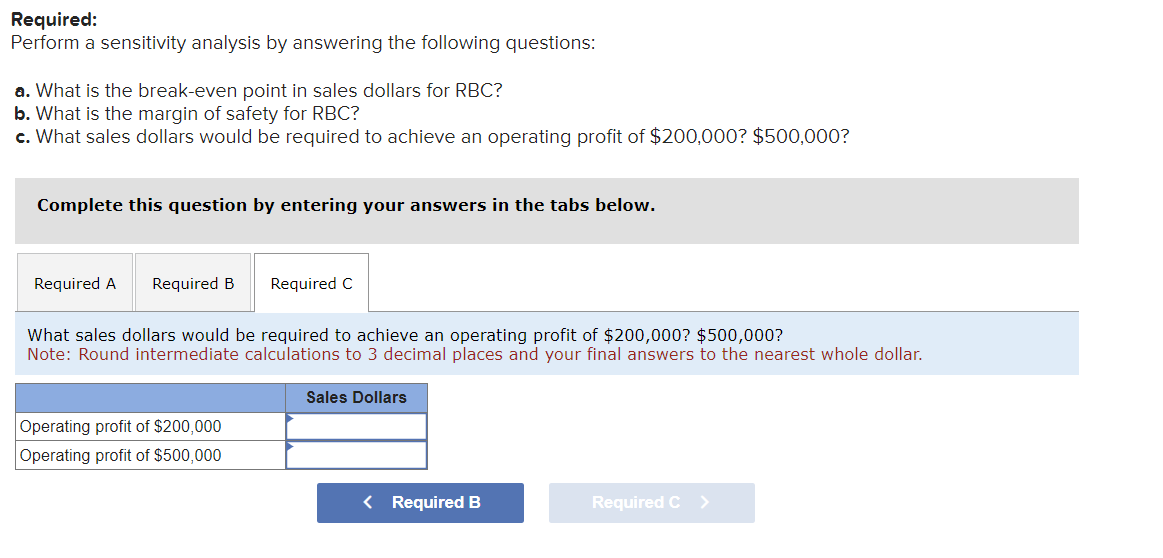
Required:
Perform a sensitivity analysis by answering the following questions:
- What is the break-even point in sales dollars for RBC?
- What is the margin of safety for RBC?
- What sales dollars would be required to achieve an operating profit of $200,000? $500,000?


Trending now
This is a popular solution!

Step by step
Solved in 4 steps with 3 images


