Three randomly selected children are surveyed. The ages of the children are 4, 5, and 9. Assume that samples of size n=2 are randomly selected with replacement from the population of 4, 5, and 9. Listed below are the nine different samples. Complete parts (a) through (d). 4,4 4,5 4,9 5,4 5,5 5,9 9,4 9,5 9,9 a. For the population, find the proportion of odd numbers. The proportion is. (Round to three decimal places as needed.) … b. Find the proportion of odd numbers of each of the nine samples, then summarize the sampling distribution of the sample proportion of odd numbers in the format of a table representing the probability distribution of the distinct proportion values. Sample Probability Proportion 11 (Type integers or simplified fractions.) c. Find the mean of the sampling distribution f the sample proportion of odd numbers. The mean is. (Round to three decimal places as needed.) d. Based on the preceding results, is the sample proportion an unbiased estimator of the population proportion? Why or why not? O A. The sample proportions do not target the proportion of odd numbers in the population, so sample proportions make good estimators of the population proportion. OB. The sample proportions do not target the proportion of odd numbers in the population, so sample proportions do not make good estimators of the population proportion. O C. The sample proportions target the proportion of odd numbers in the population, so sample proportions do not make good estimators of the population proportion. O D. The sample proportions target the proportion of odd numbers in the population, so sample proportions make good estimators of the population proportion.
Three randomly selected children are surveyed. The ages of the children are 4, 5, and 9. Assume that samples of size n=2 are randomly selected with replacement from the population of 4, 5, and 9. Listed below are the nine different samples. Complete parts (a) through (d). 4,4 4,5 4,9 5,4 5,5 5,9 9,4 9,5 9,9 a. For the population, find the proportion of odd numbers. The proportion is. (Round to three decimal places as needed.) … b. Find the proportion of odd numbers of each of the nine samples, then summarize the sampling distribution of the sample proportion of odd numbers in the format of a table representing the probability distribution of the distinct proportion values. Sample Probability Proportion 11 (Type integers or simplified fractions.) c. Find the mean of the sampling distribution f the sample proportion of odd numbers. The mean is. (Round to three decimal places as needed.) d. Based on the preceding results, is the sample proportion an unbiased estimator of the population proportion? Why or why not? O A. The sample proportions do not target the proportion of odd numbers in the population, so sample proportions make good estimators of the population proportion. OB. The sample proportions do not target the proportion of odd numbers in the population, so sample proportions do not make good estimators of the population proportion. O C. The sample proportions target the proportion of odd numbers in the population, so sample proportions do not make good estimators of the population proportion. O D. The sample proportions target the proportion of odd numbers in the population, so sample proportions make good estimators of the population proportion.

Holt Mcdougal Larson Pre-algebra: Student Edition 2012
1st Edition
ISBN:9780547587776
Author:HOLT MCDOUGAL
Publisher:HOLT MCDOUGAL
Chapter11: Data Analysis And Probability
Section11.5: Interpreting Data
Problem 1C

Related questions
Question
savage
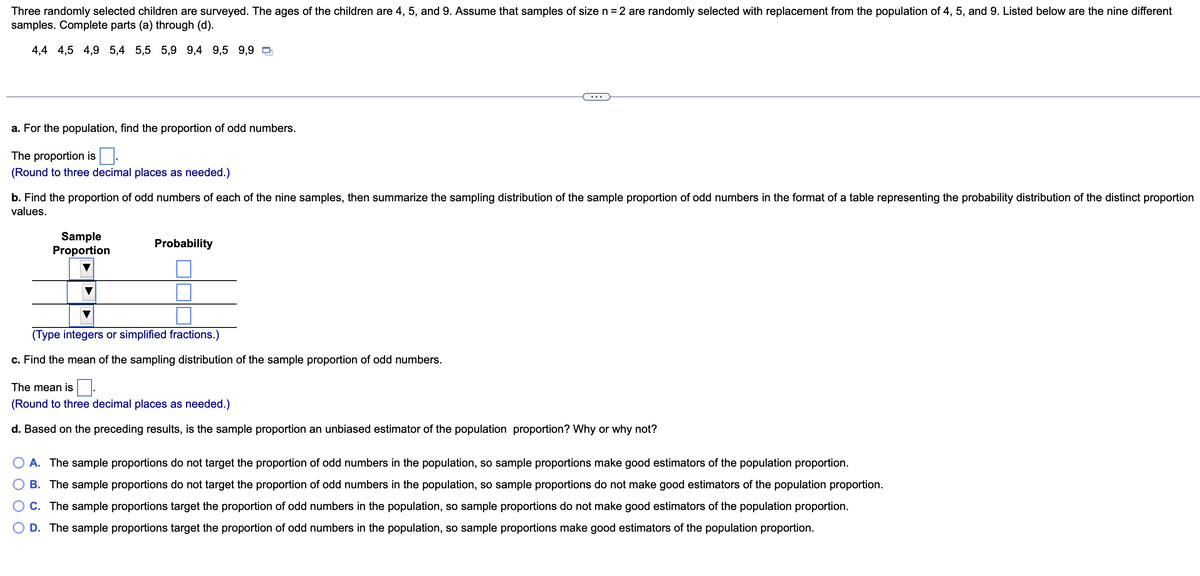
Transcribed Image Text:Three randomly selected children are surveyed. The ages of the children are 4, 5, and 9. Assume that samples of size n = 2 are randomly selected with replacement from the population of 4, 5, and 9. Listed below are the nine different
samples. Complete parts (a) through (d).
4,4 4,5 4,9 5,4 5,5 5,9 9,4 9,5 9,9
a. For the population, find the proportion of odd numbers.
The proportion is
(Round to three decimal places as needed.)
b. Find the proportion of odd numbers of each of the nine samples, then summarize the sampling distribution of the sample proportion of odd numbers in the format of a table representing the probability distribution of the distinct proportion
values.
Sample
Proportion
Probability
(Type integers or simplified fractions.)
c. Find the mean of the sampling distribution of the sample proportion of odd numbers.
The mean is
(Round to three decimal places as needed.)
d. Based on the preceding results, is the sample proportion an unbiased estimator of the population proportion? Why or why not?
A. The sample proportions do not target the proportion of odd numbers in the population, so sample proportions make good estimators of the population proportion.
B. The sample proportions do not target the proportion of odd numbers in the population, so sample proportions do not make good estimators of the population proportion.
C. The sample proportions target the proportion of odd numbers in the population, so sample proportions do not make good estimators of the population proportion.
D. The sample proportions target the proportion of odd numbers in the population, so sample proportions make good estimators of the population proportion.
Expert Solution
This question has been solved!
Explore an expertly crafted, step-by-step solution for a thorough understanding of key concepts.

This is a popular solution!

Trending now
This is a popular solution!

Step by step
Solved in 2 steps with 2 images

Recommended textbooks for you
Holt Mcdougal Larson Pre-algebra: Student Edition…
Algebra
ISBN:
9780547587776
Author:
HOLT MCDOUGAL
Publisher:
HOLT MCDOUGAL

College Algebra (MindTap Course List)
Algebra
ISBN:
9781305652231
Author:
R. David Gustafson, Jeff Hughes
Publisher:
Cengage Learning
Holt Mcdougal Larson Pre-algebra: Student Edition…
Algebra
ISBN:
9780547587776
Author:
HOLT MCDOUGAL
Publisher:
HOLT MCDOUGAL
College Algebra (MindTap Course List)
Algebra
ISBN:
9781305652231
Author:
R. David Gustafson, Jeff Hughes
Publisher:
Cengage Learning