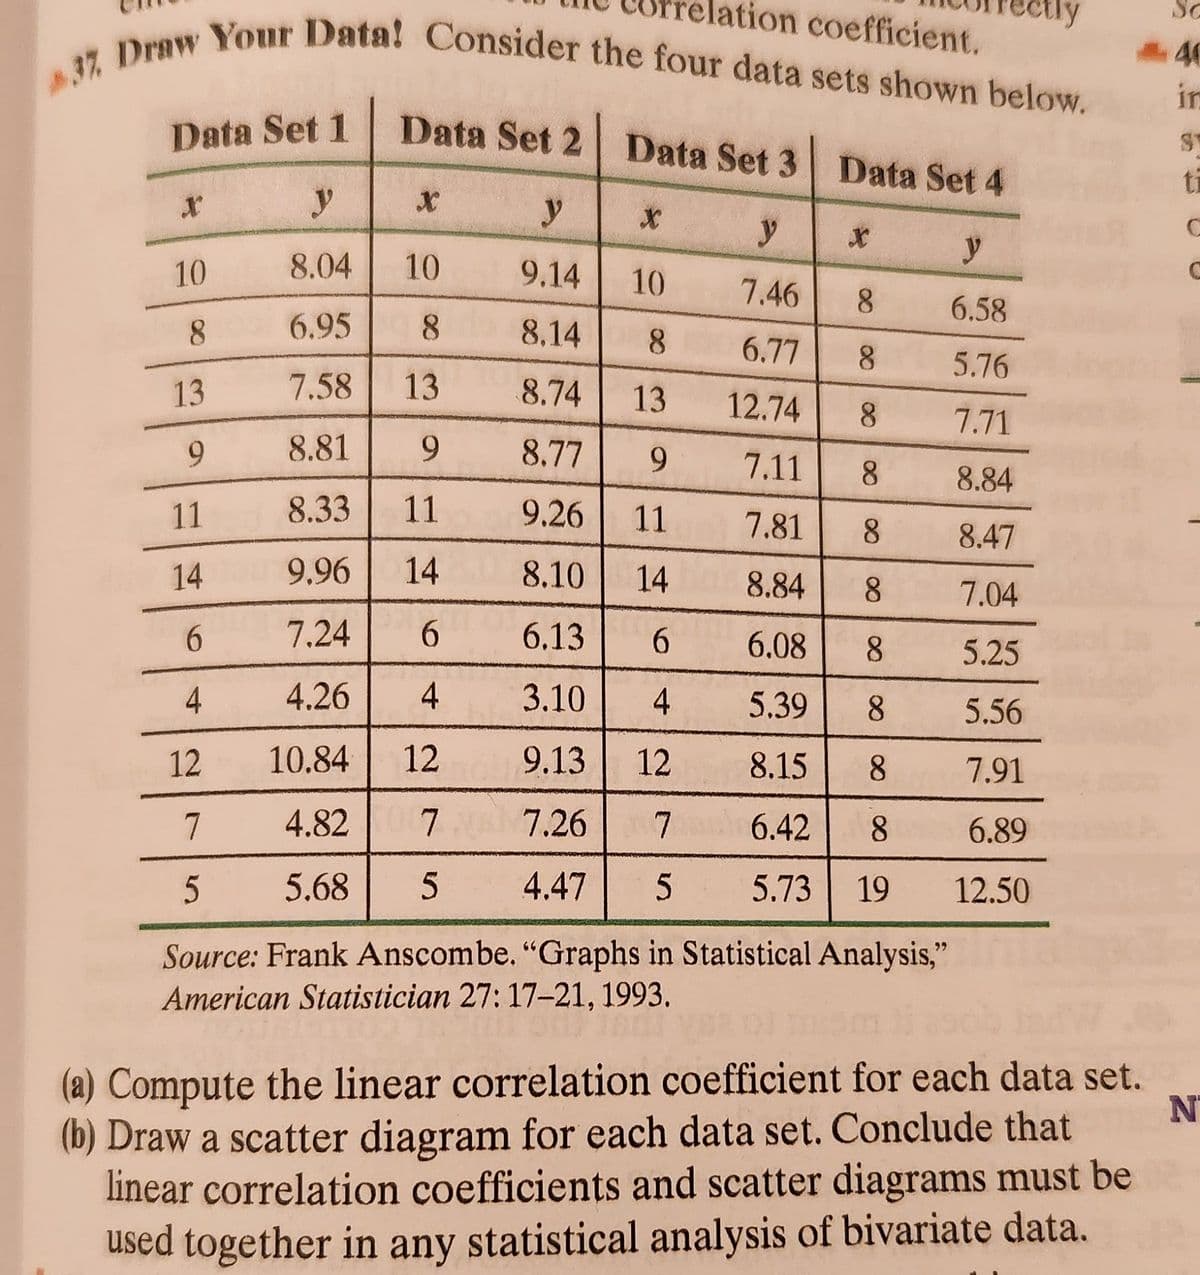
tion coefficient. 37. Draw Your Data! Consider the four data sets shown below. 44 ir Data Set 1 Data Set 2 Data Set 3 S Data Set 4 ti x y X y X y X y 10 8.04 10 9.14 10 7.46 8 6.58 8 6.95 8 8.14 8 6.77 8 5.76 13 7.58 13 8.74 13 12.74 8 7.71 9 8.81 9 8.77 9 7.11 8 8.84 11 8.33 11 9.26 11 7.81 8 8.47 14 9.96 14 8.10 14 8.84 8 7.04 6 7.24 6 6.13 6 6.08 8 5.25 4 4.26 4 3.10 4 5.39 8 5.56 12 10.84 12 9.13 12 8.15 8 7.91 7 4.82 7 7.26 7 6.42 8 6.89 5 5.68 5 4.47 5 5.73 19 12.50 Source: Frank Anscombe. "Graphs in Statistical Analysis," American Statistician 27: 17-21, 1993. (a) Compute the linear correlation coefficient for each data set. (b) Draw a scatter diagram for each data set. Conclude that linear correlation coefficients and scatter diagrams must be used together in any statistical analysis of bivariate data. N
tion coefficient. 37. Draw Your Data! Consider the four data sets shown below. 44 ir Data Set 1 Data Set 2 Data Set 3 S Data Set 4 ti x y X y X y X y 10 8.04 10 9.14 10 7.46 8 6.58 8 6.95 8 8.14 8 6.77 8 5.76 13 7.58 13 8.74 13 12.74 8 7.71 9 8.81 9 8.77 9 7.11 8 8.84 11 8.33 11 9.26 11 7.81 8 8.47 14 9.96 14 8.10 14 8.84 8 7.04 6 7.24 6 6.13 6 6.08 8 5.25 4 4.26 4 3.10 4 5.39 8 5.56 12 10.84 12 9.13 12 8.15 8 7.91 7 4.82 7 7.26 7 6.42 8 6.89 5 5.68 5 4.47 5 5.73 19 12.50 Source: Frank Anscombe. "Graphs in Statistical Analysis," American Statistician 27: 17-21, 1993. (a) Compute the linear correlation coefficient for each data set. (b) Draw a scatter diagram for each data set. Conclude that linear correlation coefficients and scatter diagrams must be used together in any statistical analysis of bivariate data. N

Glencoe Algebra 1, Student Edition, 9780079039897, 0079039898, 2018
18th Edition
ISBN:9780079039897
Author:Carter
Publisher:Carter
Chapter10: Statistics
Section10.4: Distributions Of Data
Problem 20PFA

Related questions
Question
Transcribed Image Text:tion coefficient.
37. Draw Your Data! Consider the four data sets shown below.
44
ir
Data Set 1
Data Set 2 Data Set 3
S
Data Set 4
ti
x
y
X
y
X
y
X
y
10
8.04
10
9.14
10
7.46
8
6.58
8
6.95
8
8.14
8
6.77
8
5.76
13 7.58
13
8.74
13
12.74
8
7.71
9
8.81
9
8.77
9
7.11
8
8.84
11
8.33
11
9.26
11
7.81
8
8.47
14
9.96
14
8.10
14
8.84
8
7.04
6
7.24
6
6.13
6
6.08
8
5.25
4
4.26
4
3.10
4
5.39
8
5.56
12
10.84
12
9.13
12
8.15
8
7.91
7
4.82
7
7.26
7
6.42
8
6.89
5
5.68
5 4.47 5
5.73 19
12.50
Source: Frank Anscombe. "Graphs in Statistical Analysis,"
American Statistician 27: 17-21, 1993.
(a) Compute the linear correlation coefficient for each data set.
(b) Draw a scatter diagram for each data set. Conclude that
linear correlation coefficients and scatter diagrams must be
used together in any statistical analysis of bivariate data.
N
AI-Generated Solution

Unlock instant AI solutions
Tap the button
to generate a solution
Recommended textbooks for you
Glencoe Algebra 1, Student Edition, 9780079039897…
Algebra
ISBN:
9780079039897
Author:
Carter
Publisher:
McGraw Hill
Glencoe Algebra 1, Student Edition, 9780079039897…
Algebra
ISBN:
9780079039897
Author:
Carter
Publisher:
McGraw Hill