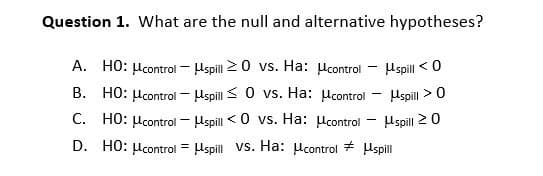
Question 1. What are the null and alternative hypotheses? A. HO: μcontrol spill ≥0 vs. Ha: μcontrol - μspill <0 B. HO: control spill 0 vs. Ha: μcontrol - μspill > 0 C. HO: μcontrol spill <0 vs. Ha: control spill ≥0 = D. HO: μcontrol spill vs. Ha: control spill


Q: 5.73 The paper “Effects of Canine Parvovirus (CPV) on Gray Wolves in Minnesota" (Journal of Wildlife…
A: 1) Here X = 25 and Y = 70. The regression line equation is given as, Y^=62.9476−0.54975∗X Substitute…
Q: A past study claimed that adults in America spent an average of 18 hours a week on leisure…
A: Let us conduct a hypothesis test to determine if there is enough evidence to conclude that the…
Q: 3. The example from lectures (the liquid filling machine) is considered for the second time. We will…
A: Understanding Confidence Intervals for Liquid Filling Machine AccuracyWe're revisiting the scenario…
Q: Typed please and asap please provide a quality solution for better ratings and please and please…
A: 1. **Simulating AR(1) Time Series**: - The `simulate_ar1` function generates a time series of…
Q: None
A: Option C is the correct answer. There is a significant interaction effect between the two factors.…
Q: Please answers questions a through d. Thank you!
A: a)State the null and alternative hypothesisSince we want to test whether Consultant A (more…
Q: How would I explain these two plots
A: Now in a Boxplot the Outliers are represented by the dots or points falling outside the ranges or…
Q: None
A: Step 1:Given that n people won a total of 5 million dollars,.As f(n) is each person's share.a) So,…
Q: None
A: Factor F1: 1.01Factor F2: 0.22Factor F3: 0.82Portfolio beta for Factor…
Q: Estimated slope…
A: The objective of the question is to interpret the MINITAB output for a regression analysis and find…
Q: A randomization distribution is shown below. Use it to find the p-value Randomization Dotplot of -,…
A: Step 1: Identify the observed sample mean: The observed sample mean is given as -0.067. Step 2:…
Q: data for two independent normal samples can be found in the table. We want to check if the…
A: The objective of this question is to determine if the population variances of two independent normal…
Q: The National Longitudinal Study of Adolescent Health interviewed several thousand teens (grades 7 to…
A: To find the percentage of females among the respondents, we need to calculate the ratio of the…
Q: Problem 7 For each of the following random variables, find P(X5), P(2 <X≤6) and P(X 5X < 8). a. X~…
A: Part a: X ~ Geometric(1/5)P(X>5)=0.3277: This indicates the probability that the first success…
Q: None
A: To determine if the single line changed the variation among the wait times for customers, we can…
Q: Typed please and asap please provide a quality solution for better ratings
A: We have the hypotheses: H0:μ=61H1:μ=61 This is a two-tailed z-test (because the population is…
Q: Among n=15 randomly selected participants of a hypothetical study, cholesterol was measured at Exam…
A: The objective of this question is to determine whether there is a statistically significant…
Q: A Kaiser Family Foundation poll for US adults in 2019 found that 79% of Democrats, 55% of…
A: The hypotheses are:Null Hypothesis (H0): p≤0.5 (the majority of Independents do not support the…
Q: 200=4(3^2x)+100 Solve for x.
A: Step 1: Step 2: Step 3: Step 4:
Q: When you are asked to examine the relationships between the two variables, whichof the following do…
A: FOR ANY QUERIES, PING ME HAPPY LEARNING
Q: Hello, may I get please help with the following? All the questions are provided in the images.…
A: A) Type 1 error is rejecting null hypothesis when it is actually true, i.e. false positive.Type 2…
Q: following quantities: XTX = 56/15 = 3.7333; XTY = 42/15 = 2.8 and YTY = 54/15 = 3.6. Ridge…
A: Ridge Regression:Q1. In ridge regression, the ridge estimate \( \hat{\beta}_{\text{ridge}}(\lambda)…
Q: A test is being designed to compare the wearing quality of two brands of tires, say brand A and…
A: This is a paired T test of the population mean. GENERAL NOTE:I used MS Excel to solve this:the…
Q: The owner of Maumee Motors wants to study the relationship between the age of a car and its selling…
A: Step 1: Calculate the Correlation Coefficient (r)Standardize the Data: This step isn't always…
Q: None
A:
Q: Announcements Section 9.2 Homework Progress saved Score: 6/13 7/13 answered Done C Account Syllabus…
A:
Q: Assume that when a human resource managers are randomly selected 51% SAP applicant should follow up…
A: Problem Breakdown:- n (number of trials): The total number of HR managers surveyed = 14.- p…
Q: A gear has been designed to have a diameter of 4 inches. The standard deviation of the process is…
A: Given the control chart, lets analyze the data.×Out of control, because there are nine consecutive…
Q: When students leave out a digit when entering an expression into their calculator some students…
A: The objective of this question is to determine whether the data provides convincing evidence that…
Q: Typed please and asap
A: To forecast monthly sales for 2022 using the data provided, we can utilize several methods. However,…
Q: 6) If X is N(45,5) for i = 1, 2,..., 25; find: 25 (a) P (30 < (X-45) < 55) 221 b) P(30< (X -45) 2 <…
A: The objective of the question is to find the probability of two different scenarios for a normally…
Q: Here are summary statistics for randomly selected weights of newborn girls: n = 243; overline x…
A: Confidence interval for Population mean is given as below:Confidence interval = Xbar ± z*S/sqrt(n)…
Q: A company sells a product which has a unit sales price of $5, unit variable cost of $3 and total…
A: The objective of this question is to find out the number of units the company must sell to break…
Q: Total Credit Cards K-Means Clustering - Q10(b) Analyze the distributions of 'Total Credit Cards' and…
A: Approach to solving the question:To approach the analysis of the distributions of 'Total Credit…
Q: I can't seem to figure out D & E
A:
Q: Suppose we want to choose 6 objects, without replacement, from 15 distinct objects.(If…
A: The objective of the question is to find out the number of ways to choose 6 objects from 15 distinct…
Q: 3. Let Y₁ 10). Hint: See example 6-3.2 in the book.
A: To find \( P(Y_6 > 10) \), we can utilize the definition of order statistics.Let's break it down…
Q: Rates of Return - ✓ deviat are in D Financial Energy Utilities fd 10.76 12.89 11.88 15.05 13.96 .…
A: Answer image:The statistical software output for this problem is: c) Fo = 2.06 OR F = 2.0651P value…
Q: Assume that when human resource managers are randomly selected 55% say job applicants should follow…
A: The binomial distribution probability is:P(X=x)=nCxpx(q)n−xwhere ::: x represents the total number…
Q: Show math only parts b and c.
A: Approach to solving the question: Detailed explanation:Answer:B) NoTo determine if the statement is…
Q: =2 = 3 = 4 = 5 6 7 8 00 Let X be a random variable with the following probability distribution.…
A: Step 1:a)The probability distribution of the random variable X is given. Step 2:Consider the…
Q: None
A: the number of elements in sample space is 120
Q: Copy the data into Excel or use your calculator to determine the line of best fit (regression…
A: Step 1: Create a spreadsheet with the known values of x's and…
Q: In a national survey college students were asked, "How often do you wear a seat belt when riding in…
A: The objective of this question is to construct a probability model for seat-belt use by a passenger…
Q: Only need (d) and (e)
A: D. The regression equation is given by the formula y(hat) = bo + b1x where b1 is the slope and bo is…
Q: Express the confidence interval -.072<p<.0608 in the form of p +- E
A: FOR ANY QUERIES, PING ME HAPPY LEARNING
Q: The lengths of pregnancies are normally distributed with a mean of 270 days and a standard deviation…
A: Pregnancy Length AnalysisGiven:Pregnancy lengths are normally distributed with a mean (μ) of 270…
Q: A spinner has 10 equally sized sections, 4 of which are yellow and 6 of which are red.…
A: The objective of this question is to find the probability of two independent events happening at the…
Q: Provide a step by step breakdown of all working and show the steps for the R codes in R Studio.…
A: Approach to solving the question/Detailed explanation:Step 1: Define Null and Alternative…
Q: A study was conducted to Investigate which intervention is most efficacious (effective) in reducing…
A: 1a. The study design is a randomized clinical trial (RCT). 1b. The null and alternative hypotheses…


Trending now
This is a popular solution!

Step by step
Solved in 2 steps

- As a result of complaints from customers about delivery times, the manager at a pizza delivery service is ready to undertake a study to determine the average delivery time. Until now, the manager has believed the delivery time was 20 minutes. Question content area bottom Part 1 What are the null and alternative hypotheses? H0: ▼ Upper X overbarX sigmaσ ss betaβ muμ alphaα ▼ equals= not equals≠ enter your response here H1: ▼ sigmaσ alphaα ss Upper X overbarX betaβ muμ ▼ equals= not equals≠ enter your response hereConsider the following: In general, when people diet they typically lose 10 lbs. (?σ = 2). A random sample of 16 people on the keto diet lost 15 lbs. Do people on the keto diet lose more or less weight than people on diets in general? 3. What is the Null Hypothesis? a)On average, weight loss in the keto diet sample does not differ from weight loss in the population of dieters in general. (H0: X-bar = Mu)) b)On average, weight loss in the keto diet sample does not differ from weight loss in the population of dieters in general. (H0: X-bar does not equal Mu) c)On average, weight loss in the keto diet sample differs from weight loss in the population of dieters in general. (H0: X-bar does not equal Mu) d)On average, weight loss in the keto diet sample differs from weight loss in the population of dieters in general. (H0: X-bar = Mu)Question 12: Test the claim that the proportion of men who own cats is larger than 50% at the .005 significance level.The null and alternative hypothesis would be: H0:p=0.5H0:p=0.5H1:p≠0.5H1:p≠0.5 H0:μ=0.5H0:μ=0.5H1:μ>0.5H1:μ>0.5 H0:μ=0.5H0:μ=0.5H1:μ<0.5H1:μ<0.5 H0:μ=0.5H0:μ=0.5H1:μ≠0.5H1:μ≠0.5 H0:p=0.5H0:p=0.5H1:p<0.5H1:p<0.5 H0:p=0.5H0:p=0.5H1:p>0.5H1:p>0.5 The test is: left-tailed two-tailed right-tailed Based on a sample of 100 people, 53% owned catsThe test statistic is: (to 2 decimals)The critical value is: (to 2 decimals)Based on this we: Reject the null hypothesis Fail to reject the null hypothesis
- Question 17: A well-known brokerage firm executive claimed that 90% of investors are currently confident of meeting their investment goals. An XYZ Investor Optimism Survey, conducted over a two week period, found that in a sample of 100 people, 81% of them said they are confident of meeting their goals.Test the claim that the proportion of people who are confident is smaller than 90% at the 0.05 significance level.The null and alternative hypothesis would be: H0:p≤0.9H0:p≤0.9H1:p>0.9H1:p>0.9 H0:μ≤0.9H0:μ≤0.9H1:μ>0.9H1:μ>0.9 H0:μ≥0.9H0:μ≥0.9H1:μ<0.9H1:μ<0.9 H0:μ=0.9H0:μ=0.9H1:μ≠0.9H1:μ≠0.9 H0:p=0.9H0:p=0.9H1:p≠0.9H1:p≠0.9 H0:p≥0.9H0:p≥0.9H1:p<0.9H1:p<0.9 The test is: two-tailed right-tailed left-tailed The test statistic is: (to 3 decimals)The p-value is: (to 4 decimals)Based on this we: Fail to reject the null hypothesis Reject the null hypothesisQUESTION 12 Historically, the proportion of people who trade in their old car to a car dealer when purchasing a new car is 48%. Over the previous 6 months, in a sample of 115 new-car buyers, 46 have traded in their old car. To determine (at the 10% level of significance) whether the proportion of new-car buyers that trade in their old car has statistically significantly decreased, what can you conclude concerning the null hypothesis?Researchers interested in lead exposure due to car exhaust sampled the blood of 52 police officers subjected to constant inhalation of automobile exhaust fumes while working traffic enforcement in a primarily urban environment. The blood samples of these officers had an average lead concentration of 124.32 µg/l and an SD of 37.74 µg/l; a previous study of individuals from a nearby suburb, with no history of exposure, found an average blood level concentration of 35 µg/l. Write down the hypotheses that would be appropriate for testing if the police officers appear to have been exposed to a higher concentration of lead. Explicitly state and check all conditions necessary for inference on these data. Test the hypothesis that the downtown police officers have a higher lead exposure than the group in the previous study. Interpret your results in context. Based on your preceding result, without performing a calculation, would a 99% confidence interval for the average blood concentration…
- QUESTION 12 Historically, the proportion of people who trade in their old car to a car dealer when purchasing a new car is 48%. Over the previous 6 months, in a sample of 115 new-car buyers, 46 have traded in their old car. To determine (at the 10% level of significance) whether the proportion of new-car buyers that trade in their old car has statistically significantly decreased, what can you conclude concerning the null hypothesis? Reject the null hypothesis Fail to reject the null hypothesisQuestion 9 A well-known brokerage firm executive claimed that 60% of investors are currently confident of meeting their investment goals. An XYZ Investor Optimism Survey, conducted over a two week period, found that in a sample of 100 people, 61% of them said they are confident of meeting their goals.Test the claim that the proportion of people who are confident is larger than 60% at the 0.10 significance level.The null and alternative hypothesis would be: H0:μ≤0.6H0:μ≤0.6H1:μ>0.6H1:μ>0.6 H0:p≥0.6H0:p≥0.6H1:p<0.6H1:p<0.6 H0:p≤0.6H0:p≤0.6H1:p>0.6H1:p>0.6 H0:μ≥0.6H0:μ≥0.6H1:μ<0.6H1:μ<0.6 H0:μ=0.6H0:μ=0.6H1:μ≠0.6H1:μ≠0.6 H0:p=0.6H0:p=0.6H1:p≠0.6H1:p≠0.6 The test is: left-tailed right-tailed two-tailed The test statistic is: (to 2 decimals)The p-value is: (to 4 decimals)Based on this we: Fail to reject the null hypothesis Reject the null hypothesisA researcher who wants to know whether the proportion of male births in a hospital is different from the established baseline of 51.07%, would like to test the following hypotheses: Ho:P = 0.51 vs. Ha :P = does not equal 0.51 a) Is the alternative hypothesis upper tail, lower tail, or two tailed? b) What do you conclude if the test results p-value of 0.03 at alpha value = 5% c) What do you conclude if the test results p-value of 0.08 at alpha value = 10%
- question 4 Chen et al. (2000) examined the foraging behaviour of northern elephant seals (Mirounga angustirostris) that breed along the west coast of Mexico and the USA. They attached platform satellite transmitter terminals (PTTs) to 22 male seals and recorded, for each seal, the distance (km) to its main feeding area offshore and the amount of time (days) it spent at the feeding area. The results are presented below: What two null hypotheses are being tested with the output shown above? What statistical conclusions would you draw about these hypotheses? Complete the regression equation by filling in the blanks (to the nearest 3 decimal places). duration = + * distance What is one biological interpretation of this relationship between duration and distance ? What % of the variation in duration at main feeding area was explained by distance to feeding area?QUESTION 19 To study whether the students at a university are more or less satisfied with the current food service compared to the previous food service, a sample of 90 current students is taken and finds that 37 are satisfied with the current food service. A similar survey was taken for the previous food service in which 89 students surveyed found that 40 were satisfied with the previous food service. When testing the hypothesis (at the 5% level of significance) a higher percentage of students were satisfied with the previous food service than with the current food service, what is the test statistic? (please round your answer to 2 decimal places)Question 1 A meal supplement provider claims that the average difference in calories between two brands is 55. Provide the following: the null and alternative hypotheses explain whether the hypothesis test is left-tailed, right-tailed, or two-tailed, • explain how you should interpret a decision that rejects the null hypothesis, and • explain how you should interpret a decision that fails to reject the null hypothesis.


