Titration Data (Standardization of EDTA) Example II Mass, g Caco, 0.0250 0.0251 0.0246 0.0254 Final reading, ml 25.00 24.91 24.87 25.31 Initial Reading, ml. 0.00 0.02 0.02 0.02 Volume, ml EDTA 25.00 Molarity of EDTA, M 0.009992 B. Analysis Data Example 25.00 Volume of Sample, mL 24.90 25.10 25.0 Final reading, mL 27.46 25.08 25.06 24.99 Initial Reading, mL 0.00 0.02 0.02 0.02 Volume of EDTA, mL 27.46 Molarity of EDTA, M 0.009992 Ca" concentration, ppm 440
Titration Data (Standardization of EDTA) Example II Mass, g Caco, 0.0250 0.0251 0.0246 0.0254 Final reading, ml 25.00 24.91 24.87 25.31 Initial Reading, ml. 0.00 0.02 0.02 0.02 Volume, ml EDTA 25.00 Molarity of EDTA, M 0.009992 B. Analysis Data Example 25.00 Volume of Sample, mL 24.90 25.10 25.0 Final reading, mL 27.46 25.08 25.06 24.99 Initial Reading, mL 0.00 0.02 0.02 0.02 Volume of EDTA, mL 27.46 Molarity of EDTA, M 0.009992 Ca" concentration, ppm 440

Chapter22: Bulk Electrolysis: Electrogravimetry And Coulometry
Section: Chapter Questions
Problem 22.33QAP

Related questions
Question
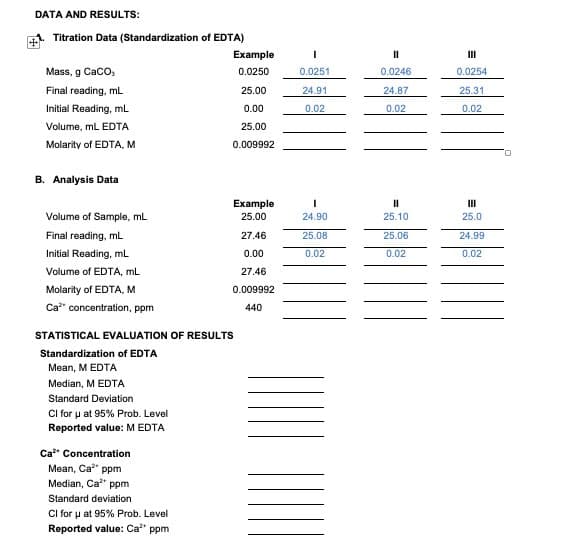
Transcribed Image Text:DATA AND RESULTS:
Titration Data (Standardization of EDTA)
Example
II
Mass, g Caco,
0.0250
0.0251
0.0246
0.0254
Final reading, mL
25.00
24.91
24.87
25.31
Initial Reading, mL
0.00
0.02
0.02
0.02
Volume, mL EDTA
25.00
Molarity of EDTA, M
0.009992
B. Analysis Data
Example
II
Volume of Sample, mL
25.00
24.90
25.10
25.0
Final reading, mL
27.46
25.08
25.06
24.99
Initial Reading, mL
0.00
0.02
0.02
0.02
Volume of EDTA, mL
27.46
Molarity of EDTA, M
0.009992
Ca" concentration, ppm
440
STATISTICAL EVALUATION OF RESULTS
Standardization of EDTA
Mean, M EDTA
Median, M EDTA
Standard Deviation
Ci for u at 95% Prob. Level
Reported value: M EDTA
Ca" Concentration
Mean, Ca" ppm
Median, Ca" ppm
Standard deviation
Cl for u at 95% Prob. Level
Reported value: Ca" ppm
Expert Solution
This question has been solved!
Explore an expertly crafted, step-by-step solution for a thorough understanding of key concepts.

Step by step
Solved in 8 steps with 5 images

Knowledge Booster


Learn more about
Need a deep-dive on the concept behind this application? Look no further. Learn more about this topic, chemistry and related others by exploring similar questions and additional content below.Recommended textbooks for you

Principles of Instrumental Analysis
Chemistry
ISBN:
9781305577213
Author:
Douglas A. Skoog, F. James Holler, Stanley R. Crouch
Publisher:
Cengage Learning
Principles of Instrumental Analysis
Chemistry
ISBN:
9781305577213
Author:
Douglas A. Skoog, F. James Holler, Stanley R. Crouch
Publisher:
Cengage Learning