to a treatment group (n₁=80) and a ontrol group (n₂=80). After the study, the treatment group had a mean serum retinol concentration of 41.73 micrograms per deciliter (µg/dL) with a standard deviation of 16.89 µg/dL, while the control group had a mean serum etinol concentration of 11.85 µg/dL with a standard deviation of 10.71 µg/dL. Does the treatment group have a igher standard deviation for serum retinol concentration than the control group at the a=0.05 level of significance? It s known that serum retinol concentration is normally distributed. Use the P-value approach to perform the test. Let o, represent the population standard deviation for the treatment group and 2 represent the population standard deviation for the control group. State the null and alternative hypotheses for this test. но: 01 H₁: 0₁ xample = Use technology to find the P-value for this test. The P-value is (Round to three decimal places as needed.) Search 02 02 Get more help - www LD (DELL M Clear all
to a treatment group (n₁=80) and a ontrol group (n₂=80). After the study, the treatment group had a mean serum retinol concentration of 41.73 micrograms per deciliter (µg/dL) with a standard deviation of 16.89 µg/dL, while the control group had a mean serum etinol concentration of 11.85 µg/dL with a standard deviation of 10.71 µg/dL. Does the treatment group have a igher standard deviation for serum retinol concentration than the control group at the a=0.05 level of significance? It s known that serum retinol concentration is normally distributed. Use the P-value approach to perform the test. Let o, represent the population standard deviation for the treatment group and 2 represent the population standard deviation for the control group. State the null and alternative hypotheses for this test. но: 01 H₁: 0₁ xample = Use technology to find the P-value for this test. The P-value is (Round to three decimal places as needed.) Search 02 02 Get more help - www LD (DELL M Clear all

MATLAB: An Introduction with Applications
6th Edition
ISBN:9781119256830
Author:Amos Gilat
Publisher:Amos Gilat
Chapter1: Starting With Matlab
Section: Chapter Questions
Problem 1P

Related questions
Question
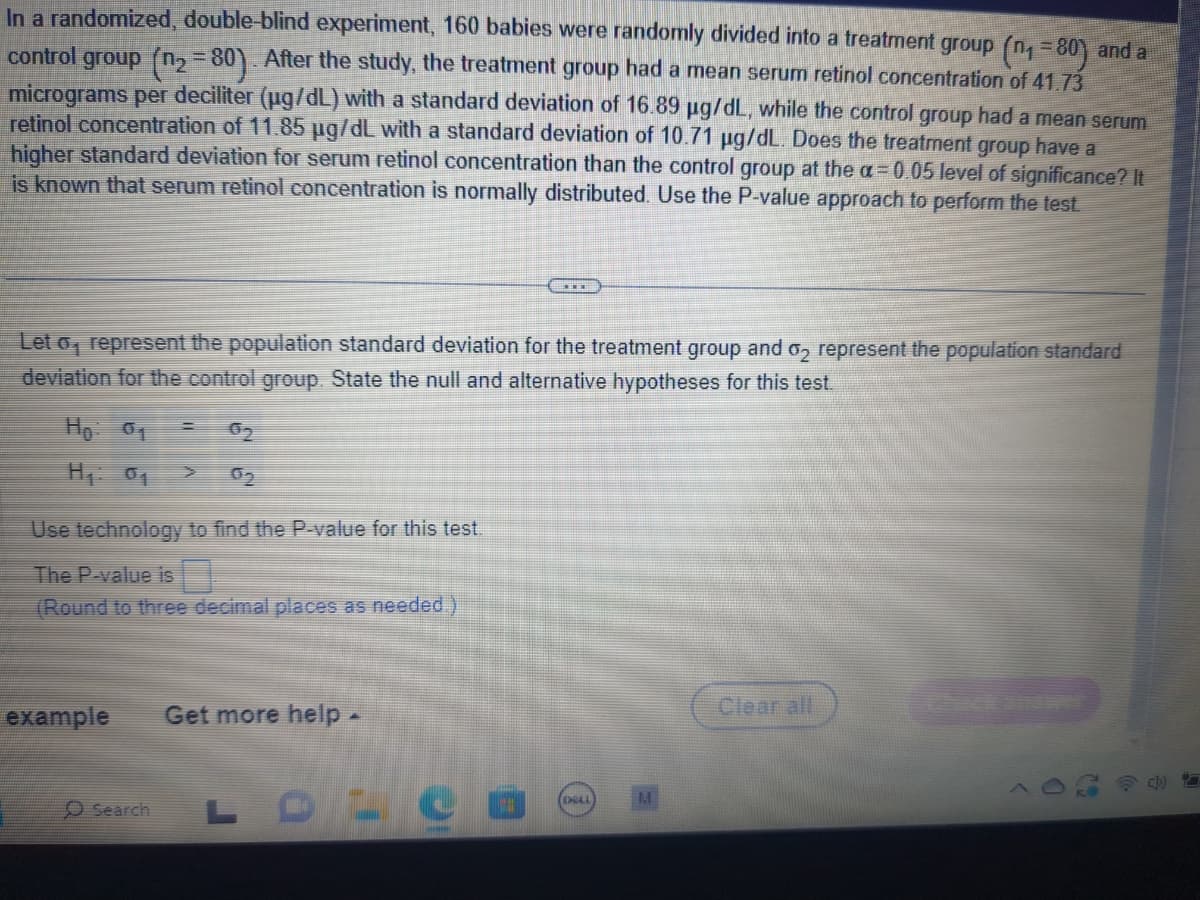
Transcribed Image Text:In a randomized, double-blind experiment, 160 babies were randomly divided into a treatment group (n₁ =80) and a
control group (n₂=80). After the study, the treatment group had a mean serum retinol concentration of 41.73
micrograms per deciliter (µg/dL) with a standard deviation of 16.89 µg/dL, while the control group had a mean serum
retinol concentration of 11.85 µg/dL with a standard deviation of 10.71 µg/dL. Does the treatment group have a
higher standard deviation for serum retinol concentration than the control group at the a= 0.05 level of significance? It
is known that serum retinol concentration is normally distributed. Use the P-value approach to perform the test.
Let o, represent the population standard deviation for the treatment group and ₂ represent the population standard
deviation for the control group. State the null and alternative hypotheses for this test.
Ho: 01
Hp: 0₁
Use technology to find the P-value for this test.
The P-value is
(Round to three decimal places as needed.)
example
02
Search
Get more help .
LDLC
(DELL
Clear all
Expert Solution
This question has been solved!
Explore an expertly crafted, step-by-step solution for a thorough understanding of key concepts.

Step by step
Solved in 2 steps with 1 images

Recommended textbooks for you
MATLAB: An Introduction with Applications
Statistics
ISBN:
9781119256830
Author:
Amos Gilat
Publisher:
John Wiley & Sons Inc

Probability and Statistics for Engineering and th…
Statistics
ISBN:
9781305251809
Author:
Jay L. Devore
Publisher:
Cengage Learning

Statistics for The Behavioral Sciences (MindTap C…
Statistics
ISBN:
9781305504912
Author:
Frederick J Gravetter, Larry B. Wallnau
Publisher:
Cengage Learning
MATLAB: An Introduction with Applications
Statistics
ISBN:
9781119256830
Author:
Amos Gilat
Publisher:
John Wiley & Sons Inc
Probability and Statistics for Engineering and th…
Statistics
ISBN:
9781305251809
Author:
Jay L. Devore
Publisher:
Cengage Learning
Statistics for The Behavioral Sciences (MindTap C…
Statistics
ISBN:
9781305504912
Author:
Frederick J Gravetter, Larry B. Wallnau
Publisher:
Cengage Learning

Elementary Statistics: Picturing the World (7th E…
Statistics
ISBN:
9780134683416
Author:
Ron Larson, Betsy Farber
Publisher:
PEARSON

The Basic Practice of Statistics
Statistics
ISBN:
9781319042578
Author:
David S. Moore, William I. Notz, Michael A. Fligner
Publisher:
W. H. Freeman

Introduction to the Practice of Statistics
Statistics
ISBN:
9781319013387
Author:
David S. Moore, George P. McCabe, Bruce A. Craig
Publisher:
W. H. Freeman