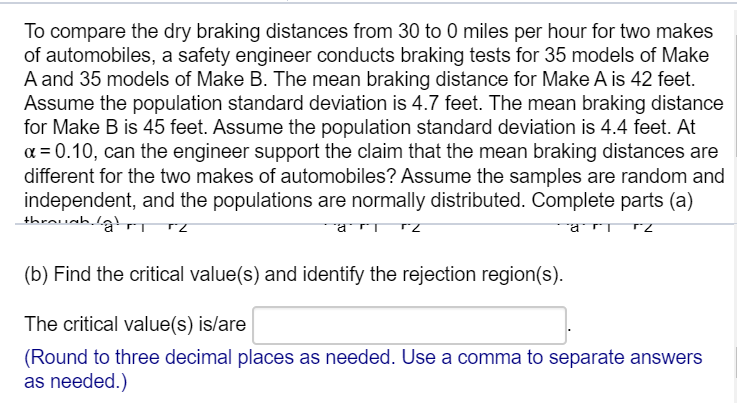
To compare the dry braking distances from 30 to 0 miles per hour for two makes of automobiles, a safety engineer conducts braking tests for 35 models of Make A and 35 models of Make B. The mean braking distance for Make A is 42 feet. Assume the population standard deviation is 4.7 feet. The mean braking distance for Make B is 45 feet. Assume the population standard deviation is 4.4 feet. At a = 0.10, can the engineer support the claim that the mean braking distances are different for the two makes of automobiles? Assume the samples are random and independent, and the populations are normally distributed. Complete parts (a) rari rz (b) Find the critical value(s) and identify the rejection region(s). The critical value(s) is/are (Round to three decimal places as needed. Use a comma to separate answers as needed.)
To compare the dry braking distances from 30 to 0 miles per hour for two makes of automobiles, a safety engineer conducts braking tests for 35 models of Make A and 35 models of Make B. The mean braking distance for Make A is 42 feet. Assume the population standard deviation is 4.7 feet. The mean braking distance for Make B is 45 feet. Assume the population standard deviation is 4.4 feet. At a = 0.10, can the engineer support the claim that the mean braking distances are different for the two makes of automobiles? Assume the samples are random and independent, and the populations are normally distributed. Complete parts (a) rari rz (b) Find the critical value(s) and identify the rejection region(s). The critical value(s) is/are (Round to three decimal places as needed. Use a comma to separate answers as needed.)

MATLAB: An Introduction with Applications
6th Edition
ISBN:9781119256830
Author:Amos Gilat
Publisher:Amos Gilat
Chapter1: Starting With Matlab
Section: Chapter Questions
Problem 1P

Related questions
Question
Transcribed Image Text:To compare the dry braking distances from 30 to 0 miles per hour for two makes
of automobiles, a safety engineer conducts braking tests for 35 models of Make
A and 35 models of Make B. The mean braking distance for Make A is 42 feet.
Assume the population standard deviation is 4.7 feet. The mean braking distance
for Make B is 45 feet. Assume the population standard deviation is 4.4 feet. At
a = 0.10, can the engineer support the claim that the mean braking distances are
different for the two makes of automobiles? Assume the samples are random and
independent, and the populations are normally distributed. Complete parts (a)
rari rz
(b) Find the critical value(s) and identify the rejection region(s).
The critical value(s) is/are
(Round to three decimal places as needed. Use a comma to separate answers
as needed.)
Expert Solution
This question has been solved!
Explore an expertly crafted, step-by-step solution for a thorough understanding of key concepts.

This is a popular solution!

Trending now
This is a popular solution!

Step by step
Solved in 2 steps

Knowledge Booster


Learn more about
Need a deep-dive on the concept behind this application? Look no further. Learn more about this topic, statistics and related others by exploring similar questions and additional content below.Recommended textbooks for you
MATLAB: An Introduction with Applications
Statistics
ISBN:
9781119256830
Author:
Amos Gilat
Publisher:
John Wiley & Sons Inc

Probability and Statistics for Engineering and th…
Statistics
ISBN:
9781305251809
Author:
Jay L. Devore
Publisher:
Cengage Learning

Statistics for The Behavioral Sciences (MindTap C…
Statistics
ISBN:
9781305504912
Author:
Frederick J Gravetter, Larry B. Wallnau
Publisher:
Cengage Learning
MATLAB: An Introduction with Applications
Statistics
ISBN:
9781119256830
Author:
Amos Gilat
Publisher:
John Wiley & Sons Inc
Probability and Statistics for Engineering and th…
Statistics
ISBN:
9781305251809
Author:
Jay L. Devore
Publisher:
Cengage Learning
Statistics for The Behavioral Sciences (MindTap C…
Statistics
ISBN:
9781305504912
Author:
Frederick J Gravetter, Larry B. Wallnau
Publisher:
Cengage Learning

Elementary Statistics: Picturing the World (7th E…
Statistics
ISBN:
9780134683416
Author:
Ron Larson, Betsy Farber
Publisher:
PEARSON

The Basic Practice of Statistics
Statistics
ISBN:
9781319042578
Author:
David S. Moore, William I. Notz, Michael A. Fligner
Publisher:
W. H. Freeman

Introduction to the Practice of Statistics
Statistics
ISBN:
9781319013387
Author:
David S. Moore, George P. McCabe, Bruce A. Craig
Publisher:
W. H. Freeman