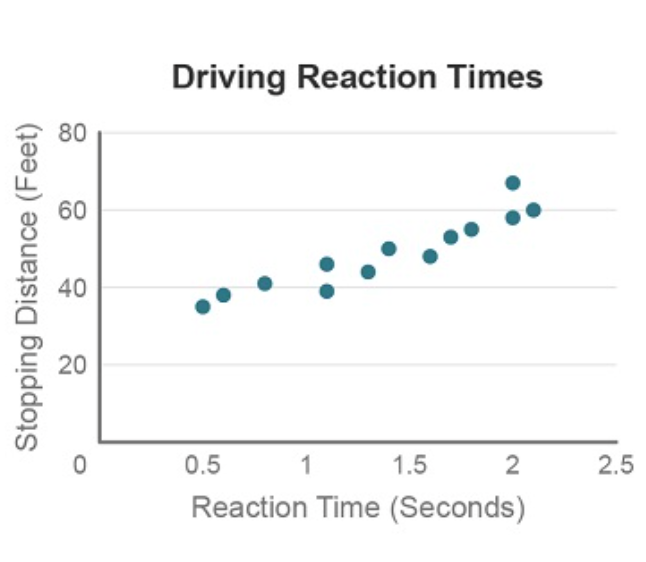
To investigate the influence of distracted driving, 13 volunteers were asked to participate in a study involving a driving simulator. The participants drove at a safe speed but were told to stop the car at a random moment during the simulation. The scatterplot shows the reaction time and the simulated car’s stopping distance (in feet) for each volunteer. The value of r for the scatterplot is 0.935. How would the correlation change if the stopping distances were recorded in meters, rather than feet? The value of the correlation coefficient would not change. Since the points would be more spread out, the value of the correlation coefficient would decrease. Since the number of meters would be less than the number of feet, the value of the correlation coefficient would increase. Since the number of meters would be less than the number of feet, the value of the correlation coefficient would decrease.
To investigate the influence of distracted driving, 13 volunteers were asked to participate in a study involving a driving simulator. The participants drove at a safe speed but were told to stop the car at a random moment during the simulation. The scatterplot shows the reaction time and the simulated car’s stopping distance (in feet) for each volunteer. The value of r for the scatterplot is 0.935. How would the correlation change if the stopping distances were recorded in meters, rather than feet? The value of the correlation coefficient would not change. Since the points would be more spread out, the value of the correlation coefficient would decrease. Since the number of meters would be less than the number of feet, the value of the correlation coefficient would increase. Since the number of meters would be less than the number of feet, the value of the correlation coefficient would decrease.

Chapter3: Functions
Section3.3: Rates Of Change And Behavior Of Graphs
Problem 1TI: Using the data in Table 1 at the beginning of this section, find the average rate of change between...

Related questions
Question
To investigate the influence of distracted driving, 13 volunteers were asked to participate in a study involving a driving simulator. The participants drove at a safe speed but were told to stop the car at a random moment during the simulation. The
How would the
The value of the correlation coefficient would not change.
Since the points would be more spread out, the value of the correlation coefficient would decrease.
Since the number of meters would be less than the number of feet, the value of the correlation coefficient would increase.
Since the number of meters would be less than the number of feet, the value of the correlation coefficient would decrease.
Transcribed Image Text:Driving Reaction Times
80
60
40
0.5
1
1.5
2
2.5
Reaction Time (Seconds)
Stopping Distance (Feet)
20
Expert Solution
This question has been solved!
Explore an expertly crafted, step-by-step solution for a thorough understanding of key concepts.

This is a popular solution!

Trending now
This is a popular solution!

Step by step
Solved in 2 steps

Recommended textbooks for you

Functions and Change: A Modeling Approach to Coll…
Algebra
ISBN:
9781337111348
Author:
Bruce Crauder, Benny Evans, Alan Noell
Publisher:
Cengage Learning

Algebra & Trigonometry with Analytic Geometry
Algebra
ISBN:
9781133382119
Author:
Swokowski
Publisher:
Cengage
Functions and Change: A Modeling Approach to Coll…
Algebra
ISBN:
9781337111348
Author:
Bruce Crauder, Benny Evans, Alan Noell
Publisher:
Cengage Learning
Algebra & Trigonometry with Analytic Geometry
Algebra
ISBN:
9781133382119
Author:
Swokowski
Publisher:
Cengage

College Algebra (MindTap Course List)
Algebra
ISBN:
9781305652231
Author:
R. David Gustafson, Jeff Hughes
Publisher:
Cengage Learning

Intermediate Algebra
Algebra
ISBN:
9781285195728
Author:
Jerome E. Kaufmann, Karen L. Schwitters
Publisher:
Cengage Learning

Big Ideas Math A Bridge To Success Algebra 1: Stu…
Algebra
ISBN:
9781680331141
Author:
HOUGHTON MIFFLIN HARCOURT
Publisher:
Houghton Mifflin Harcourt